The DuPont Analysis Template includes three slides. DuPont Analysis, named after the company that developed it, is a method used for dissecting a company’s return on equity (ROE). It’s a technique that assesses three critical components of a company’s performance: profitability, operating efficiency, and leverage.
DuPont Analysis, a financial assessment tool, can provide essential insights into a company’s performance. Just like SWOT analysis, we need to evaluate the internal performance first. But what is DuPont Analysis, and how can it help businesses make more informed decisions? Let’s dive in and explore!
The Birth of DuPont Analysis
DuPont Model was born out of a need to understand the subtleties of a company’s profitability better. It was developed in the 1920s by F. Donaldson Brown, a financial expert at the DuPont Corporation. It’s a technique that goes beyond surface-level metrics to provide a more accurate picture of a company’s financial health.
The Essence of DuPont Ratio Analysis
The real value of the DuPont ratio analysis lies in its ability to break down the standard ROE calculation into three distinct elements, which are components of dupont analysis:
- Net Profit Margin: This ratio measures the amount of net income generated from every dollar of revenue. The higher the ratio, the better, indicating higher profitability.
- Total Asset Turnover: This ratio shows the amount of revenue generated for every dollar’s worth of assets, evaluating the company’s efficiency in using its assets.
- Equity Multiplier: This ratio determines the extent to which the company relies on debt financing. The higher the number, the more debt the company has.
By examining these three factors individually, the DuPont Analysis can provide a much more nuanced understanding of a company’s ROE.
The DuPont Analysis Formula
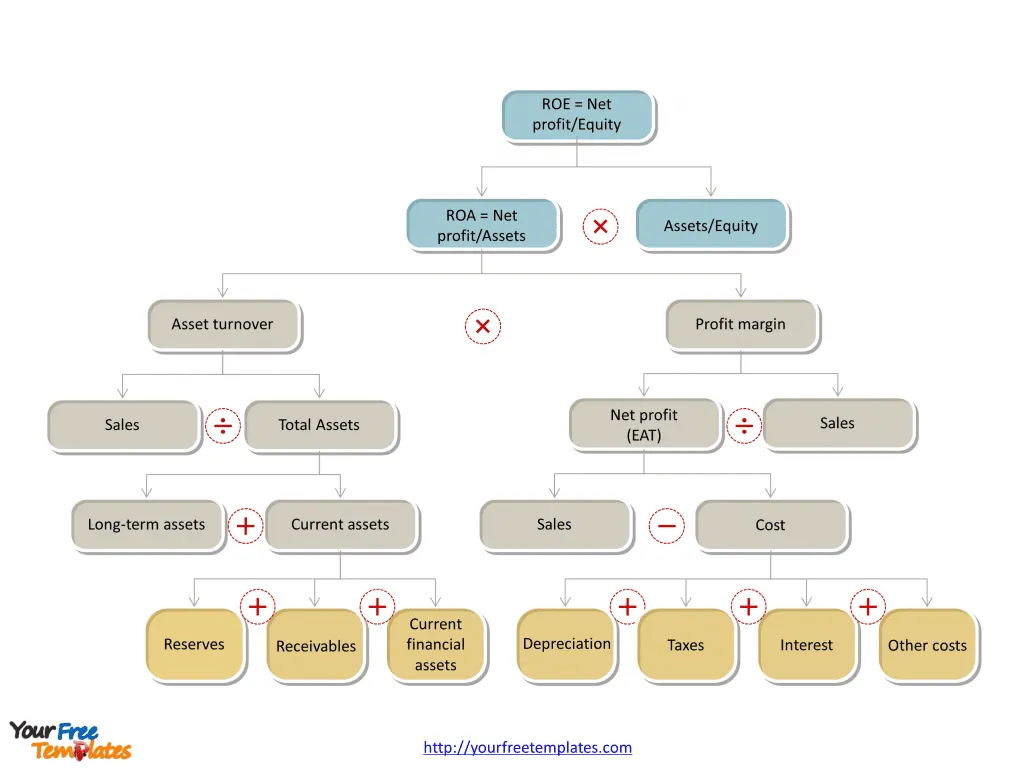
The DuPont ratio analysis formula is essentially a breakdown of the ROE calculation. It can be expressed as follows:
(Net Income ÷ Sales) x (Sales ÷ Assets) x (Assets ÷ Equity)
This formula allows the analyst to evaluate each component’s contribution to the company’s ROE separately.
Slide 1,Dupont ROE Analysis (the return on equity ) analysis

Understanding the Components of DuPont ROE Analysis
Let’s delve a bit deeper into the three components of the DuPont Model.
Net Profit Margin
Net Profit Margin is a measure of a company’s profitability. It shows how much profit a company makes for every dollar it generates in revenue. Management can increase sales by reducing prices, which might reduce the net profit margin. This strategy can work effectively for low-cost firms.
Total Asset Turnover
Total Asset Turnover is a measure of a company’s operating efficiency. It shows the amount of sales generated for every dollar’s worth of assets. A higher ratio is generally better, indicating a more efficient use of assets. However, this ratio tends to be inversely related to the net profit margin.
Equity Multiplier
The Equity Multiplier is a measure of a company’s financial leverage. It shows the extent to which the company relies on debt financing. A higher number indicates more debt. While taking on debt can increase a company’s return on equity, it also increases the risk of default.
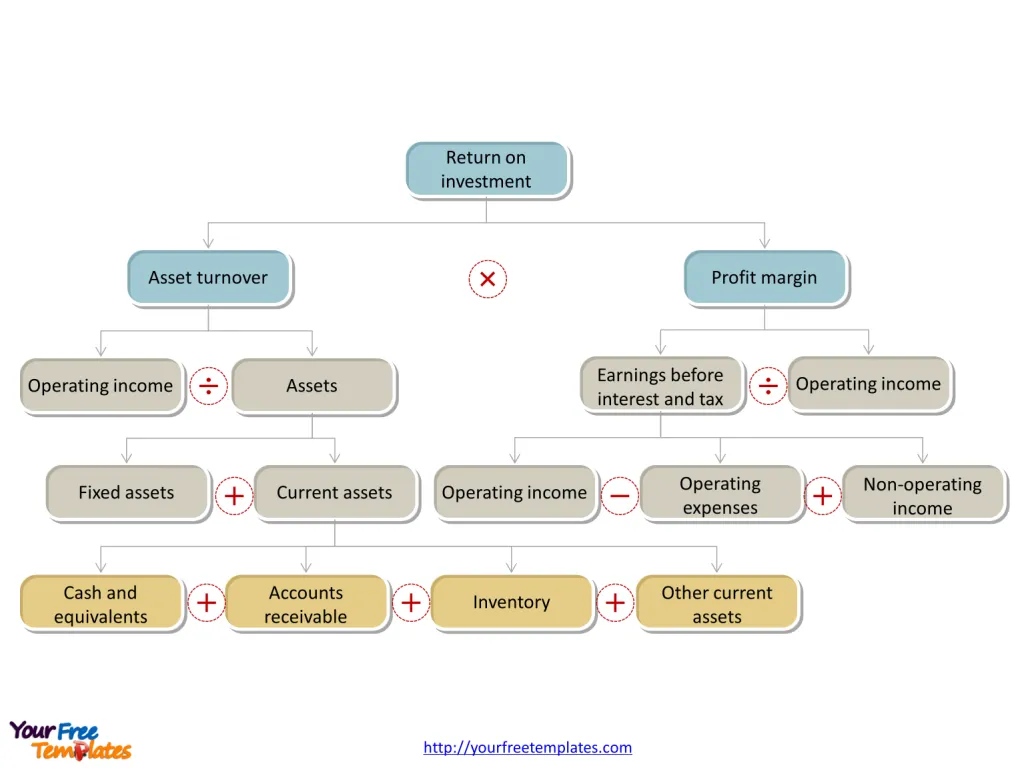
Slide 2, ROI (the return on investment) model analysis in vertical direction for Dupont analysis model

Interpreting DuPont ROE Analysis
The beauty of DuPont ROE Analysis is that it allows you to interpret changes in a company’s ROE more accurately. For instance, if a company’s ROE increases due to an improved net profit margin or increased asset turnover, this is a positive sign. However, if the equity multiplier is the cause of the increase, the company could be over-leveraged, which is risky.
The Five-Step DuPont Model
The 5 step dupont analysis doesn’t separate operating activities from financing activities. To address this, a more detailed five-step DuPont model can be used, further breaking down the components used in the basic model.
DuPont Analysis: A Useful Metric
DuPont Analysis is just one of many metrics used to evaluate companies. However, it’s a valuable tool that can provide a more in-depth understanding of a company’s financial performance.
DuPont Analysis in Practice
DuPont Analysis is a practical tool that can help businesses make more informed decisions. By breaking down ROE into its components, it provides a clearer picture of a company’s financial health. It can help businesses identify areas of strength and weakness, allowing them to make strategic adjustments as needed.
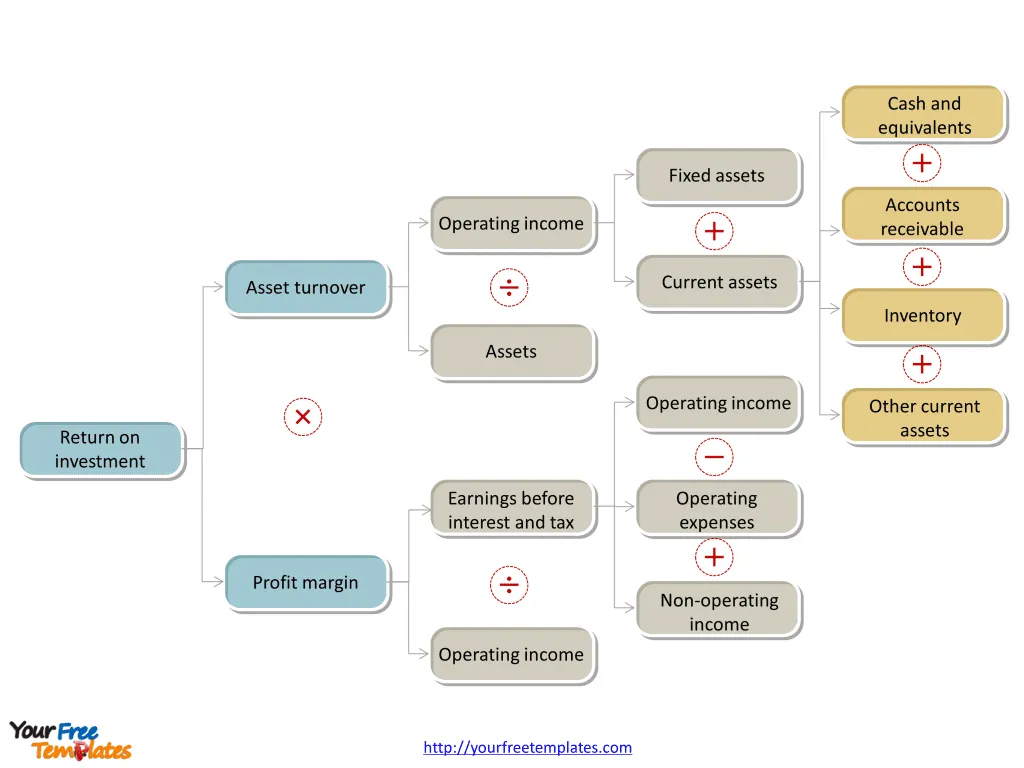
Slide 3, the same model analysis as above in horizontal direction for Dupont analysis

Conclusion
DuPont Analysis is a powerful tool for assessing a company’s financial performance. It provides a more nuanced understanding of a company’s return on equity, helping businesses make more informed decisions. However, like any financial analysis tool, it should be used as part of a broader analysis, and its results should be compared with industry benchmarks for a more accurate assessment.
Whether you’re a financial analyst, a business owner, or an investor, understanding the DuPont ratio Analysis formula and how to apply it can be an invaluable skill. So why not start using DuPont Analysis today and gain a deeper understanding of your company’s financial performance?
In spite of positives and negatives for nearly a century, the DuPont Model can provide business managers insight to understand fundamental drivers of profitability. So for the return on investment is an ideal investment analysis tool. You can refer to detailed explanation of DuPont analysis in Wikipedia.
Size: 91K
Type: PPTX
Aspect Ratio: Standard 4:3
Click the blue button to download it.
Download the 4:3 Template
Aspect Ratio: Widescreen 16:9
Click the green button to download it.
Download the 16:9 Template


