The Gantt Chart Powerpoint Template in PowerPoint format includes six slides. Firstly we have the free Gantt chart templates with Excel data. Secondly we develop simple Gantt chart with PPT tables with different weeks. As the same diagram PowerPoint template series, you can also find our Weekly Schedule Template, 2021 calendar monthly template, and Printable calendar 2021 template.
What is a gantt chart? Definition, History, Applications, and Purpose
The chart is a popular project management tool that provides a visual representation of a project schedule. It illustrates the start and finish dates of the various elements of a project. The chart is named after Henry Gantt, an American mechanical engineer and management consultant who developed this tool in the 1910s.
History
- Henry Gantt created the Gantt chart as a visual aid to show the progression of projects.
- Initially used in shipbuilding during World War I, Gantt charts gained popularity in various industries for project management.
Slide 1,Gantt chart excel template-1
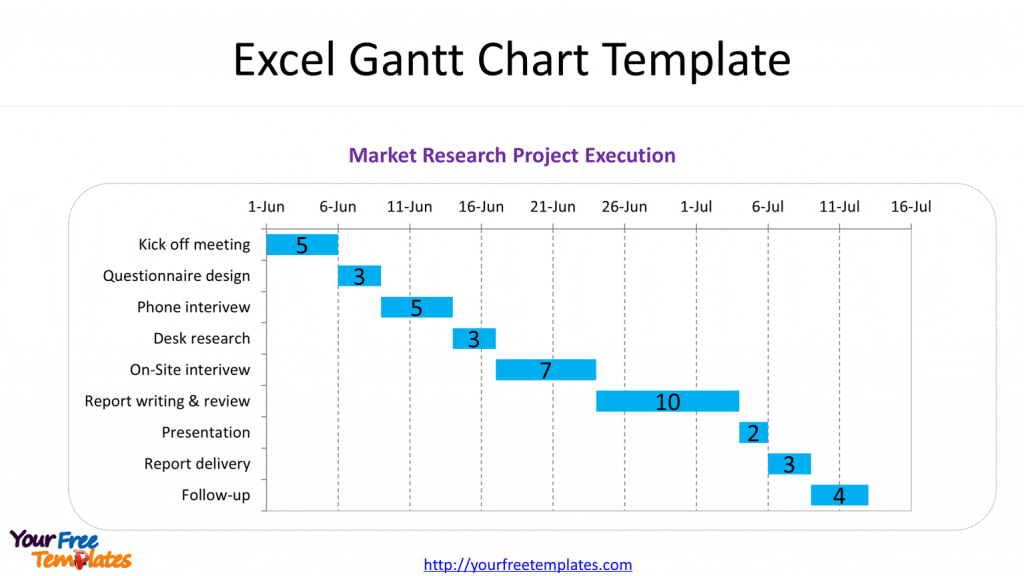
One key point of developing Gantt chart is to select the reverse order category for the vertical axis format. When it is done, the date axis will show above the chart instead of in the lower section as before.
Slide 2, Gantt chart excel template-2
Just follow the format data in this excel sheet, and carefully calculate the duration of each item. Then it comes to the key points for excel Gantt chart that you need to input the data value of starting day, here is 44348 for June 1, 2021. But what we can do to convert a day into a 5-digit data, here we can take cell B13 as an example. By changing the cell formats from date to value, you did it. At last, you still have to modify the horizontal axis format by defining the minimum value to 44348.
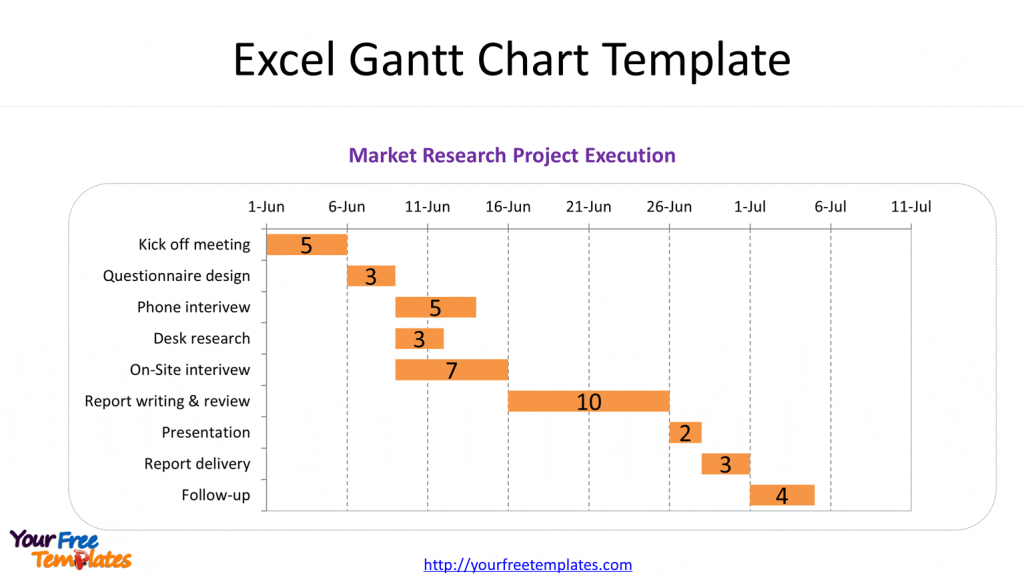
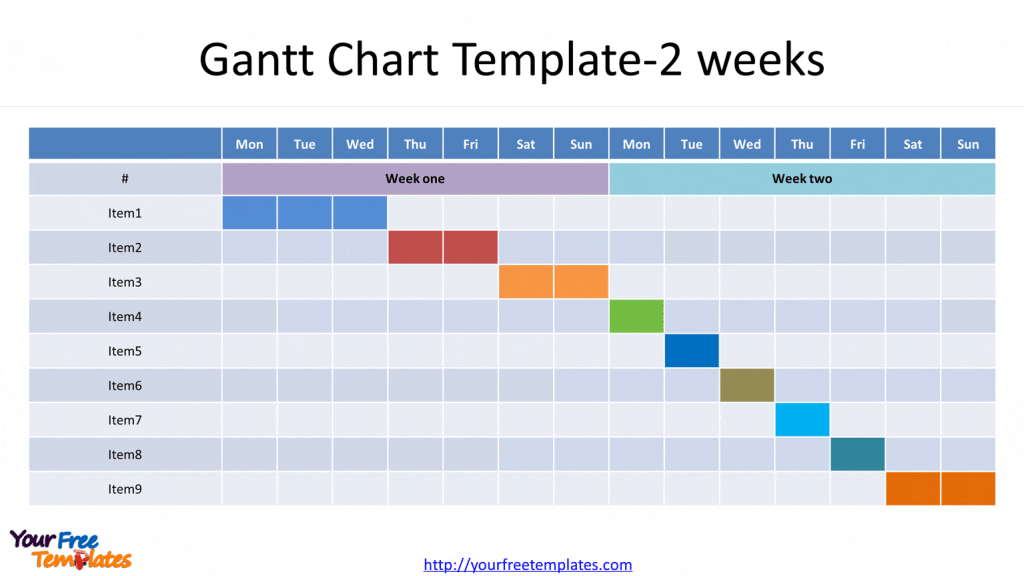
Slide 3, Gantt chart powerpoint template for two weeks
The horizontal axis is representing the total time span of the project, breaking down into days and a vertical axis for the tasks that make up the project. For the time it will be from the starting date to the ending dates. While for the activities it is from first task to the last task based on the sequence. You can easily add or remove the columns to customize the numbers of tasks.
