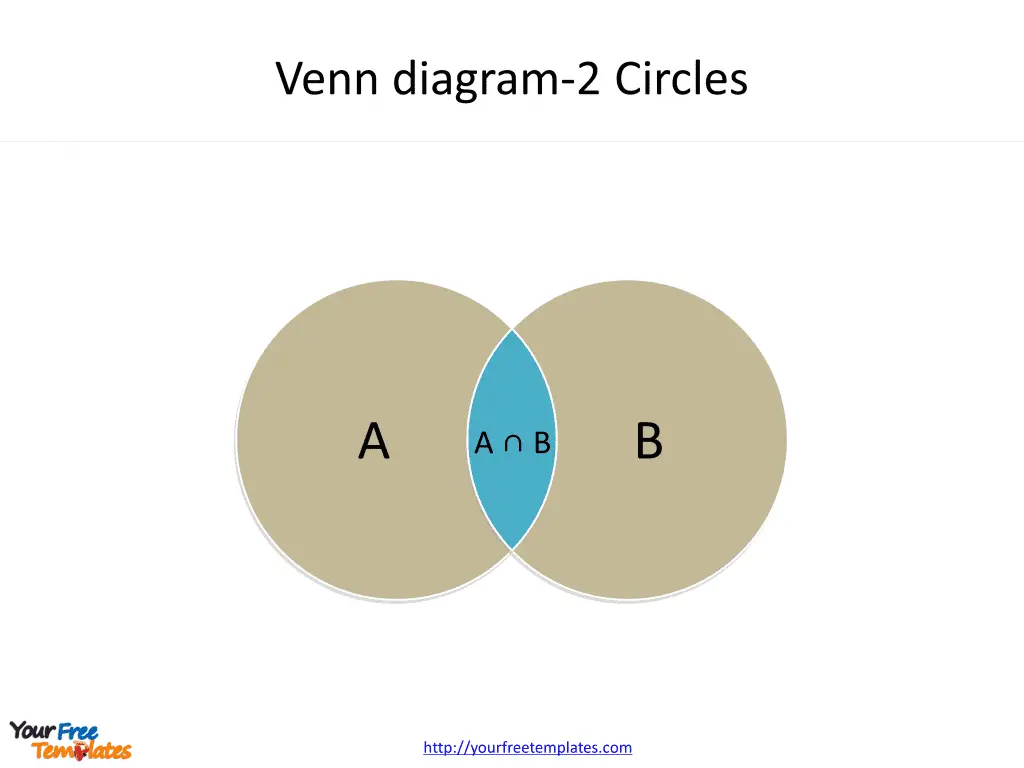
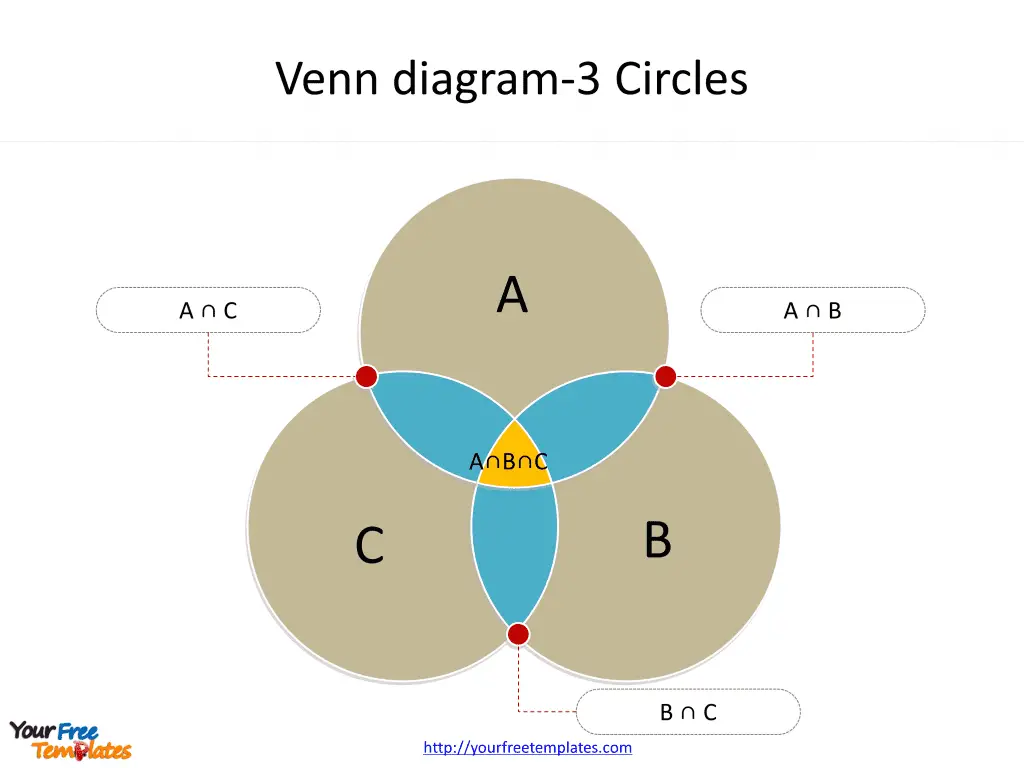
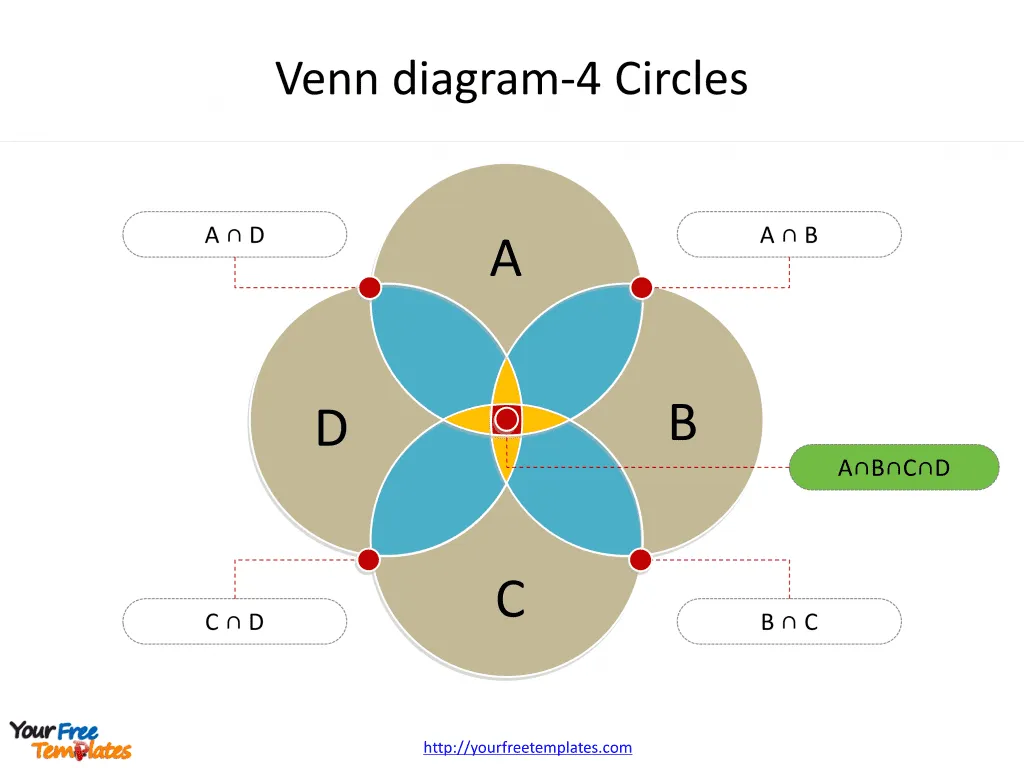
The Venn diagram Template in PowerPoint format includes three slides. Firstly we have the Intersection and union with two circles. Secondly we present Venn diagram with three circles. Thirdly Intersection and union are composed of four circles. As the same diagram PowerPoint template series, you can also find our Maslow’s hierarchy of needs, Data Mining, Machine Learning, cloud computing, Artificial Intelligence and BlockChain PowerPoint templates.
What is a venn diagram?
A Venn diagram is a graphical representation of the relationships between different sets of items. They consist of overlapping circles or other shapes, with each circle representing a set and the overlapping areas representing the elements that are shared between the sets.
Purpose:
- Visualizing Relationships: Euler diagrams are used to illustrate the relationships between different sets of data, making it easier to understand the similarities and differences.
- Logical Reasoning: They are helpful in logic, probability, statistics, and computer science to visually organize information and solve problems.
- Education: Venn charts are widely used in educational settings to teach set theory and logical thinking.
Slide 1 Venn chart with two circles.
Venn diagrams are powerful tools used to visualize the relationships between different sets of items. They come in various forms, including those with two circles, three circles, and four circles, each serving different purposes in various fields.
Venn Diagram with Two Circles
A Euler diagrams with two circles is a simple yet effective tool for illustrating the relationships and differences between two sets of data. It consists of two overlapping circles, each representing a distinct set, with the overlapping area representing the elements shared by both sets.
Applications:
- Comparative Analysis: It is widely used in business and marketing to compare and contrast two different products, services, or market segments.
- Probability and Logic: In mathematics and statistics, it is utilized to visually represent the intersection and union of events, aiding in the comprehension of probability and logical reasoning.
- Classroom Education: Teachers use two-circle Venn diagrams to teach students about similarities and differences between two concepts, characters in a story, or historical events.

Slide 2 Euler diagram with three circles.
A Euler diagrams with three circles extends the concept of the two-circle diagram to illustrate the relationships between three sets of data. It consists of three overlapping circles, demonstrating the interactions and distinctions between the three sets.
Applications:
- Data Analysis: In data science, three-circle Venn diagrams are utilized to analyze the relationships between three distinct datasets, identifying commonalities and differences.
- Categorical Comparisons: It is employed in market research to categorize and compare three different market segments, identifying the overlap and unique characteristics of each segment.
- Problem Solving: In logic and reasoning, three-circle Venn diagrams are used to solve problems related to syllogisms and categorical propositions.

Slide 3 Venn diagram with four circles example.
A Euler diagram with four circles allows for the visualization of the relationships between four sets of data, providing a comprehensive overview of the similarities and differences between the sets.
Applications:
- Genetics and Biology: Four-circle Venn diagrams are used in genetics to compare and contrast the characteristics of four different genetic traits or organisms.
- Business Strategy: In strategic management, it is employed to analyze the competitive landscape by comparing the strengths and weaknesses of four different competitors or companies.
- Intersection Analysis: It is used in urban planning to analyze the intersection of four different factors such as transportation, infrastructure, environment, and community needs.

Conclusion
Euler diagrams with two, three, and four circles are versatile tools that find applications across diverse fields, including mathematics, statistics, education, business, science, and more. Their ability to visually represent the relationships between multiple sets of data makes them invaluable for analysis, problem-solving, and decision-making.
Looking for Premium maps, please visit our affiliate site: https://editablemaps.com/ or https://ofomaps.com/
Size:81K
Type: PPTX
Aspect Ratio: Standard 4:3
Click the blue button to download it.
Download the 4:3 Template
Aspect Ratio: Widescreen 16:9
Click the green button to download it.
Download the 16:9 Template


