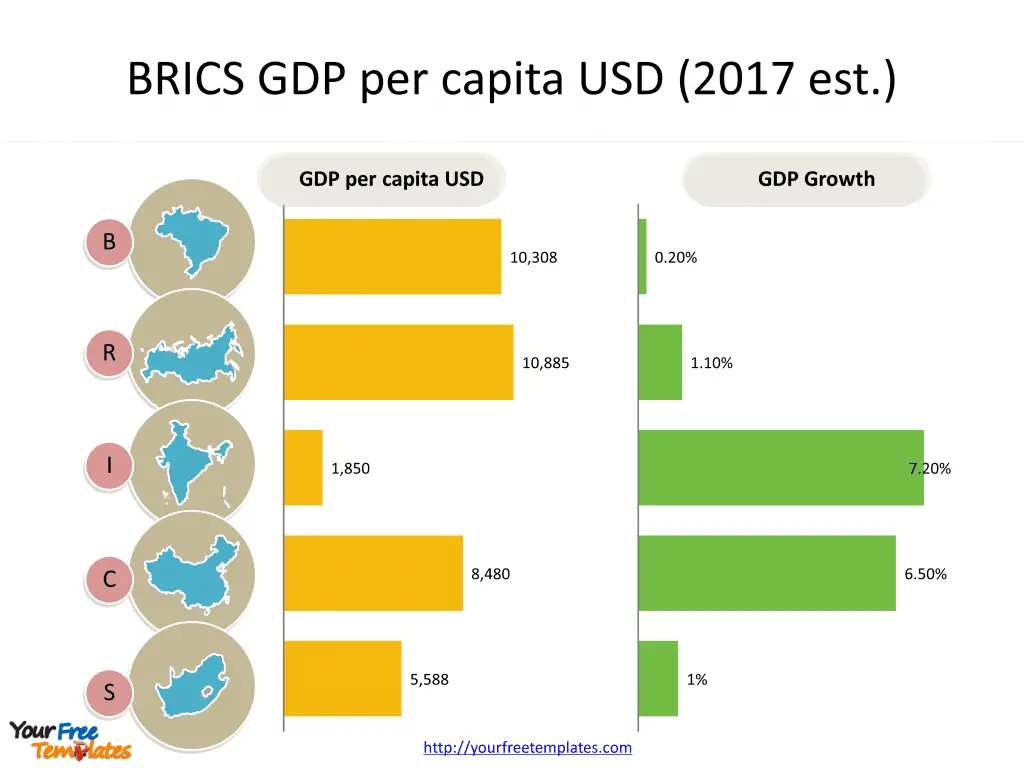
Slide 3, Compare data among BRICS combined with bar charts.
Add Contextual Information: Provide contextual information about the BRICS countries, their populations, economic indicators, and geopolitical significance alongside the maps to offer a comprehensive understanding of the region.
Data says everything. From the bar charts, we can see that although the GDP per capita USD for India is quite low now, but it has enjoyed high growth rate.

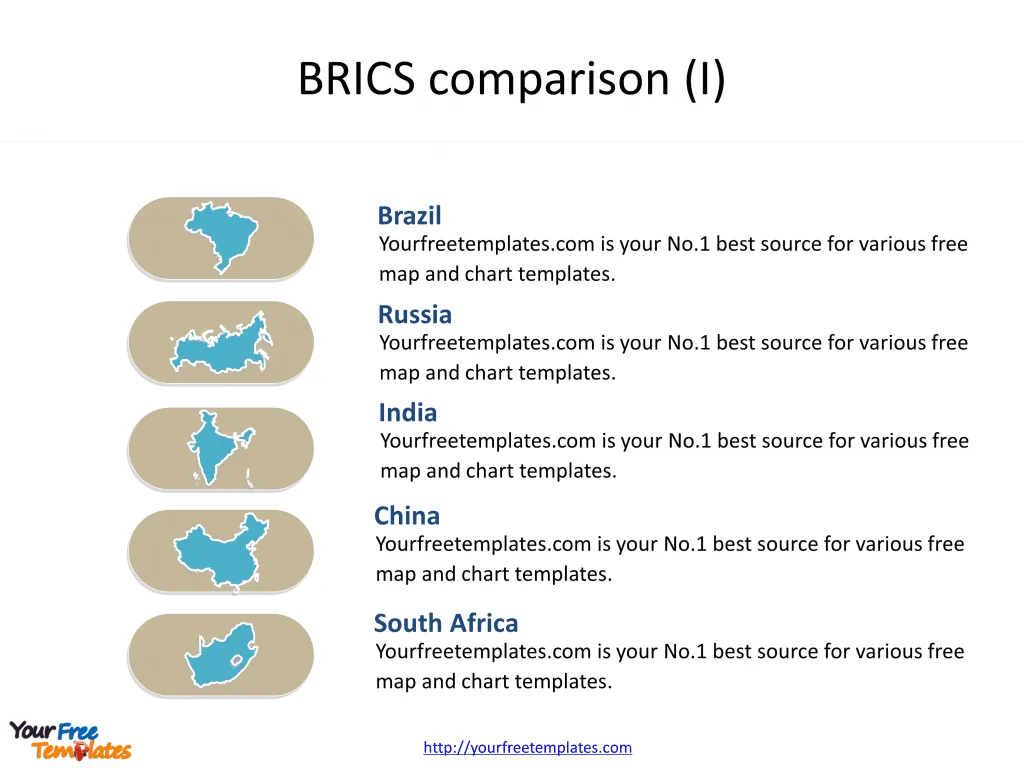
Slide 4, Text description among BRICS with uniform shapes.
Again we use map icons to represent the countries.


