The Business Intelligence infographic in PowerPoint format includes five slides. Firstly we explore what is Business Intelligence? Then are the three levels of the hierarchy and definition of Business intelligence. Finally it is the data categories and implementation steps. As the same series, you can also find our Data Mining, Cloud platform, Machine Learning, Internet of Things, Artificial Intelligence, Industry 4.0 and BlockChain, Digital marketing, Big data PowerPoint templates.
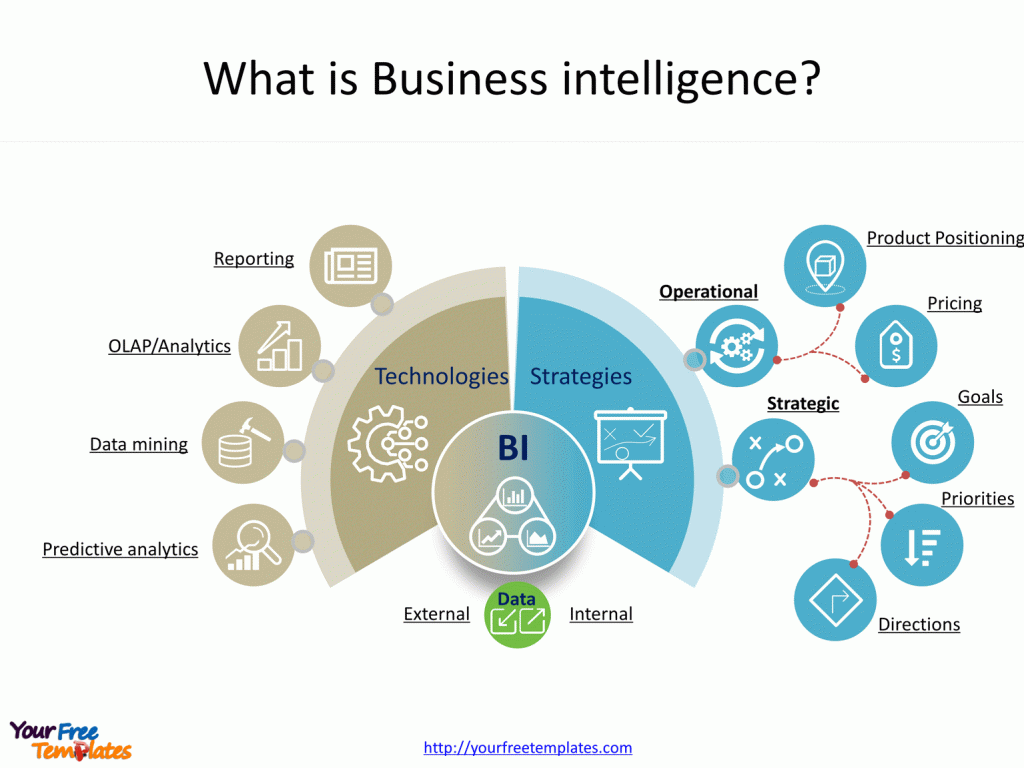
Slide 1, What is Business intelligence?
Business Intelligence (BI) is a suite of technologies and strategies used by companies for data analysis and management. Through BI processes, businesses can extract insights from data, generate reports, and support decision-making. BI tools enable organizations to transform raw data into meaningful and useful information for business purposes, helping to improve strategic and tactical business decisions.
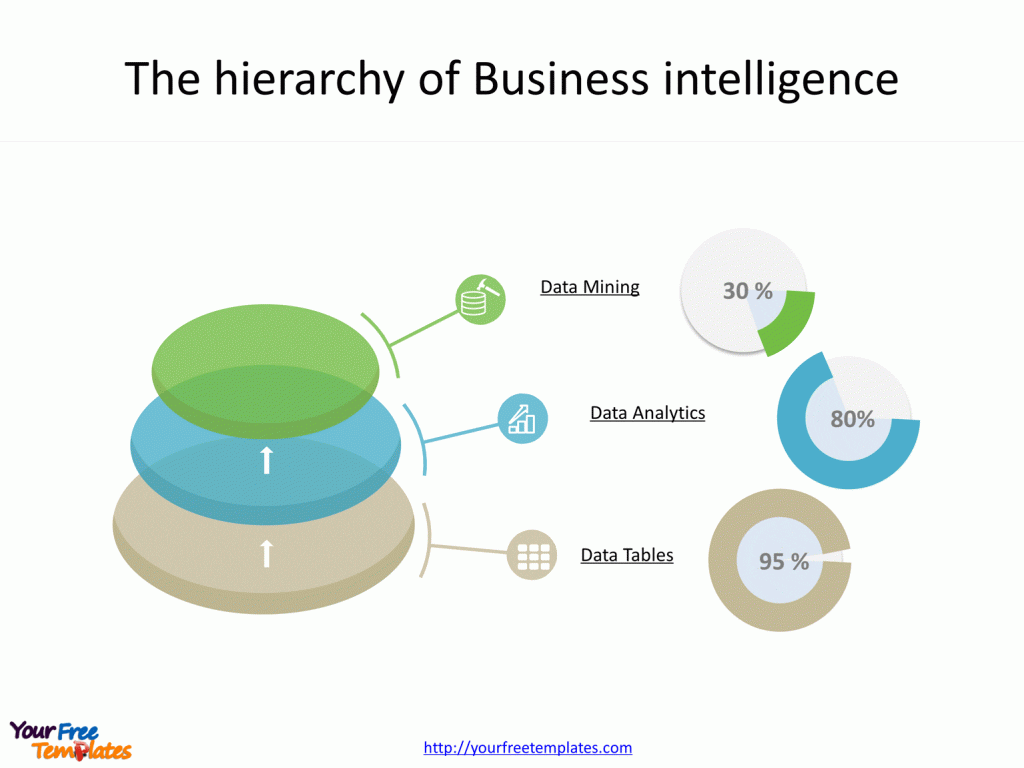
Slide 2, The hierarchy of Business intelligence
There are three levels of Business intelligence, from the lowest to the highest are data tables, data analytics and data mining. The higher the level is, the more difficulty the implementation would be. Nowadays most of the companies have used data tables to provide some reports at regular basis. At the same time, some companies have also adopted advanced analytical tools to present multi-dimensional relationships. It is just a few enterprises enjoy the capabilities to deploy data mining tools to uncover the potentials of huge stream of data.
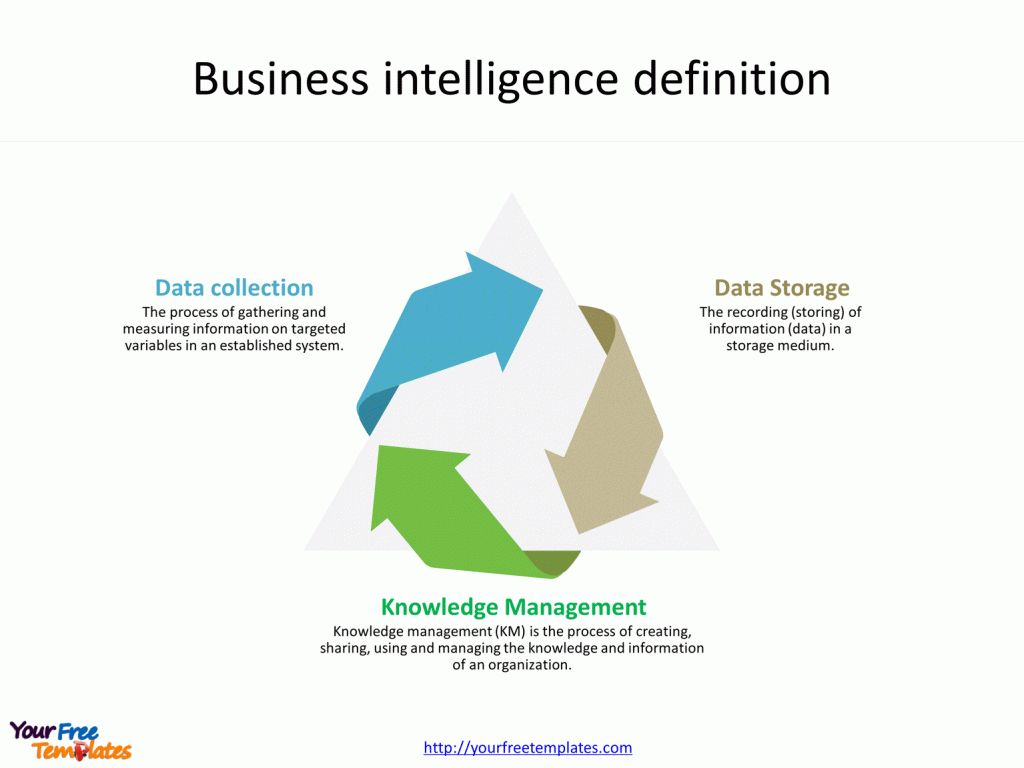
Slide 3, Business intelligence definition
Business Intelligence (BI) is a technology-driven process for analyzing data and presenting actionable information to help executives, managers, and other corporate end users make informed business decisions. BI encompasses a variety of tools, applications, and methodologies that enable organizations to collect data from internal systems and external sources, prepare it for analysis, develop and run queries against the data, and create reports, dashboards, and data visualizations to make the analytical results available to corporate decision-makers as well as operational workers.
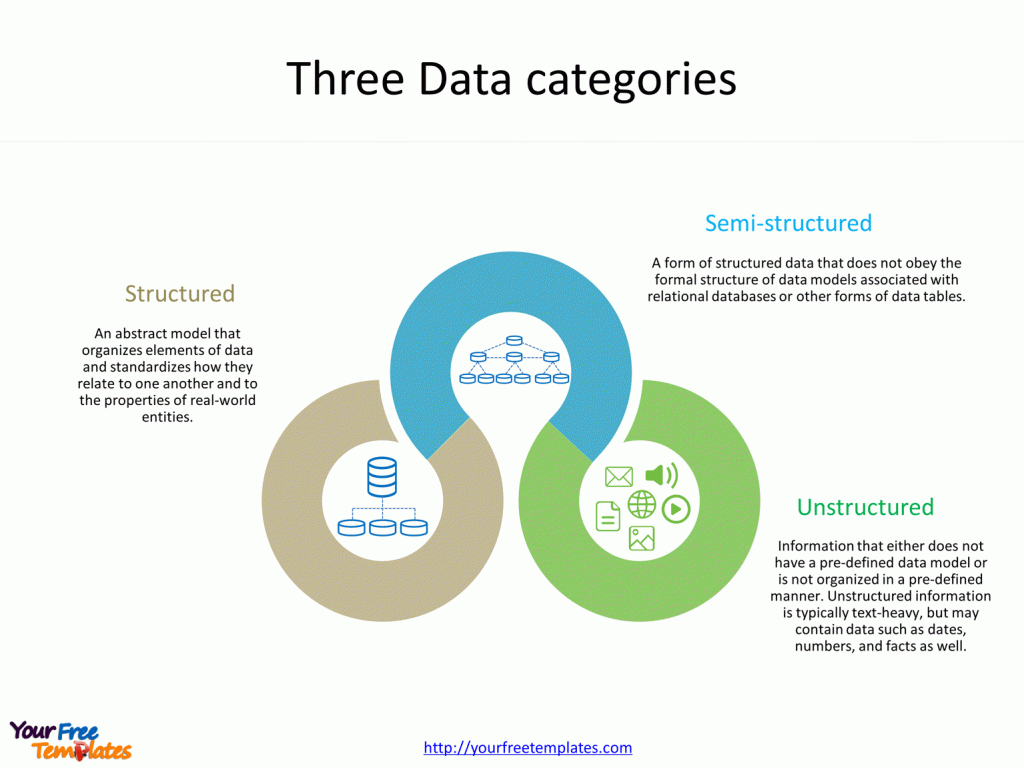
Slide 4, Three Data categories
It is well known that we have data categories of structured data, semi-structured data and unstructured data.
Structured Data
Structured data refers to data that is highly organized and formatted in a way that is easily searchable by simple, straightforward search engine algorithms or other search operations. It is often stored in relational databases (RDBMS) and is accessible through structured query language (SQL). Examples include numbers, dates, and strings in spreadsheets or databases.
Semi-Structured Data
Semi-structured data is a form of data that does not reside in a relational database but has some organizational properties that make it easier to analyze. With semi-structured data, tags or other markers are used to separate semantic elements and enforce hierarchies of records and fields. JSON and XML are common formats.
Unstructured Data
Unstructured data is information that either does not have a pre-defined data model or is not organized in a pre-defined manner. It is typically text-heavy, but may contain data such as dates, numbers, and facts as well. This category includes books, journals, documents, metadata, health records, audio, video, and images.
Slide 5, BI implementation
There are 7 steps for BI implementation in total.
- Define Objectives: Clearly outline what you want to achieve with BI, setting specific, measurable goals that align with business strategy.
- Data Collection: Gather data from various sources such as internal databases, cloud storage, and external datasets. Ensure the data is relevant and of high quality.
- Data Integration: Consolidate collected data into a centralized system. This may involve data warehousing where disparate data is transformed and stored in a unified format.
- Analysis: Utilize BI tools to analyze the integrated data. This can involve querying, data mining, and statistical analysis to uncover patterns and insights.
- Reporting: Convert analysis results into reports, dashboards, and visualizations that communicate findings effectively to stakeholders.
- Decision-Making: Use the insights gained from BI to inform and guide strategic decisions, making sure to consider the implications and potential business impact.
- Review and Refine: Regularly assess the BI system’s performance and the accuracy of its outputs. Make adjustments to processes, objectives, and tools as needed to maintain relevance and efficiency.
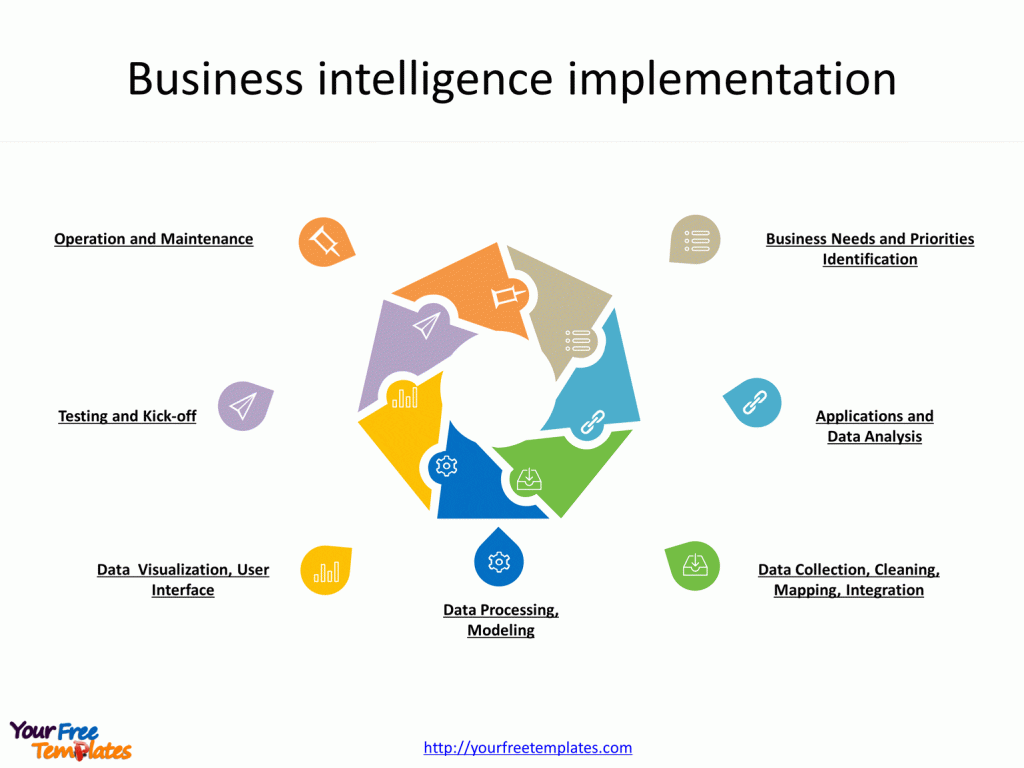
Implementing BI is a cyclical process, requiring ongoing evaluation and adjustment to adapt to new data, changing business environments, and evolving organizational goals.
Looking for Premium maps, please visit our affiliate site: https://editablemaps.com/ or https://ofomaps.com/
Size:180K
Type: PPTX
[sociallocker]Aspect Ratio: Standard 4:3
Click the blue button to download it.
Download the 4:3 Template
Aspect Ratio: Widescreen 16:9
Click the green button to download it.
Download the 16:9 Template[/sociallocker]


