The Data analysis Template in PowerPoint format includes three slides. Firstly we have the process of data analysis. Secondly we present Quantitative messages from Data analysis. Finally is Data analysis data conversion. As the same diagram PowerPoint template series, you can also find our Data Mining, Machine Learning, cloud computing, Artificial Intelligence, Industry 4.0 and BlockChain , Digital marketing and other more PowerPoint templates.
Data analysis is a process of inspecting, cleansing, transforming and modeling data with the goal of discovering useful information, informing conclusion and supporting decision-making.
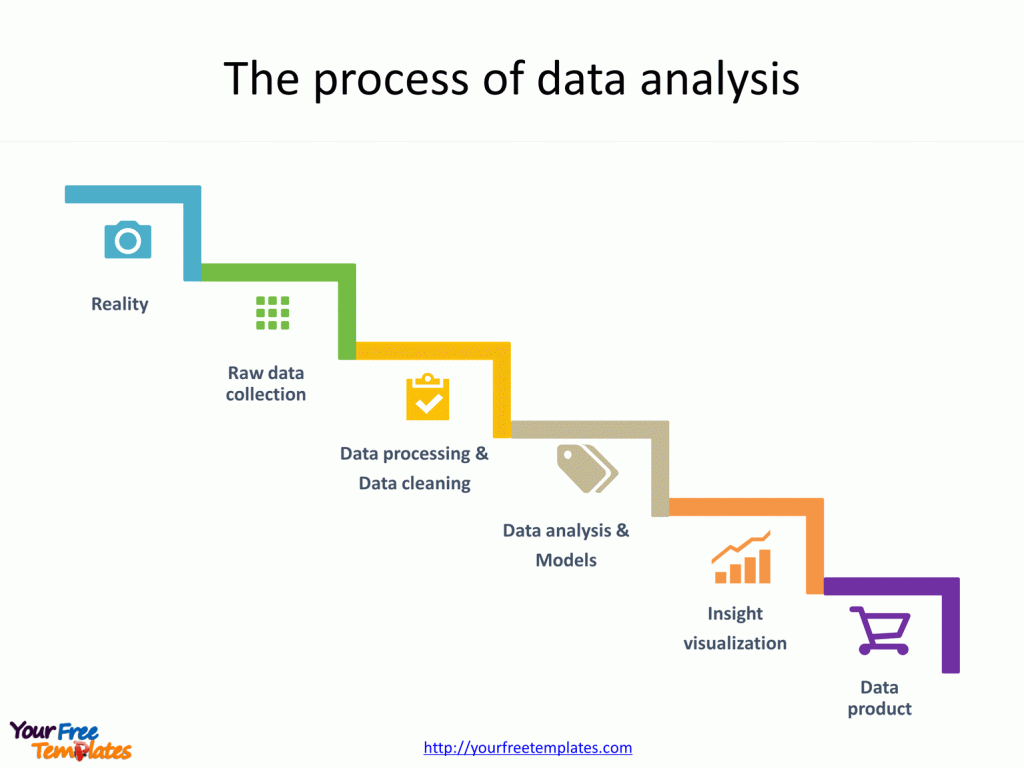
Slide 1, the process of data analysis
Data analysis is a comprehensive process that transforms raw data into meaningful insights for decision-making and problem-solving. This process involves several crucial steps:
- Defining Objectives: Clearly establishing what you want to achieve from the analysis.
- Data Collection: Gathering data from various sources relevant to the objectives.
- Data Cleaning: Removing inaccuracies and inconsistencies to ensure data quality.
- Data Exploration: Examining the data to identify patterns and anomalies.
- Data Transformation: Modifying data to facilitate analysis (e.g., normalization).
- Data Modeling: Applying statistical or machine learning models to understand relationships or predict outcomes.
- Data Validation: Assessing the model for accuracy and reliability.
- Data Visualization and Interpretation: Presenting the findings in an understandable format to inform decision-making.

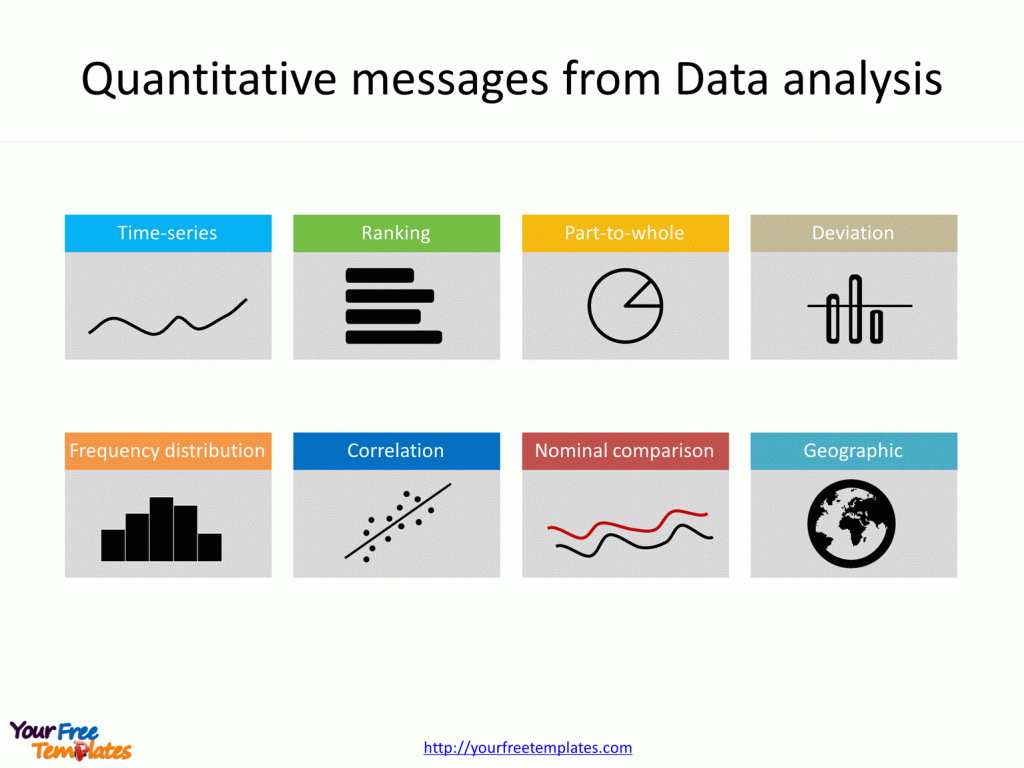
Slide 2, Quantitative messages from Data analysis
Quantitative data analysis can yield a variety of insights, each serving a specific purpose in interpreting the data. Eight notable types include:
- Trends: Changes in data points over time, indicating upward or downward movements.
- Patterns: Recurring sequences or relationships within the data that may suggest a correlation.
- Comparisons: Differences or similarities between groups or categories within the data.
- Relationships: Connections between different variables that may indicate cause and effect.
- Anomalies: Outliers or unexpected data points that deviate from the norm.
- Distributions: The spread of data points, showing how they are distributed across a range.
- Predictions: Forecasts about future data points based on historical data trends and patterns.
- Benchmarks: Standards or reference points that allow for performance comparison over time or across different datasets.
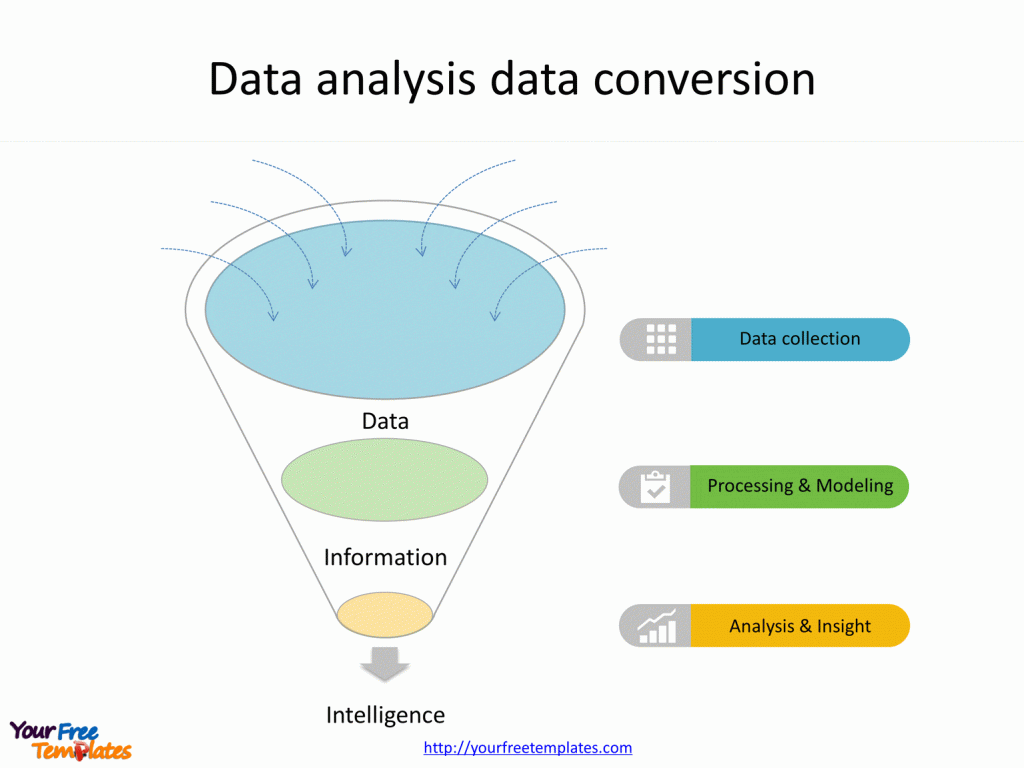
Slide 3, Data analysis data conversion
The relationship between data, information, and intelligence is a hierarchical and transformative process:
- Data represents raw, unprocessed facts and figures without context. It could be numbers, words, or images captured from various sources.
- Information is data that has been processed, organized, or structured in a way that gives it meaning. Through analysis, data is converted into information, making it understandable and useful for decision-making.
- Intelligence goes a step further by integrating information with knowledge and context to support sophisticated decision-making and problem-solving. Intelligence involves the application of analytical reasoning, experience, and expertise to interpret information, predict outcomes, and make informed decisions.

In essence, data is transformed into information through analysis, and information is elevated to intelligence through interpretation and contextual application. This progression underscores the importance of data analysis in extracting actionable insights, enabling organizations and individuals to make well-informed decisions based on a deeper understanding of underlying trends, patterns, and relationships within the data.
Data analysis is the systematic process of collecting, cleaning, transforming, and modeling data to discover useful information, suggest conclusions, and support decision-making. It involves applying statistical, logical, and analytical techniques to data sets to identify patterns, trends, and relationships that are not immediately apparent.
The purpose of data analysis is multifaceted: it aims to help businesses and organizations make informed decisions, improve operational efficiency, forecast future trends, and solve complex problems. By extracting actionable insights from raw data, data analysis becomes a critical tool in shaping strategies, optimizing performance, and gaining a competitive edge in various sectors.
For detailed info on it, please refer to Wikipedia.
Size:92K
Type: PPTX
[sociallocker]Aspect Ratio: Standard 4:3
Click the blue button to download it.
Download the 4:3 Template
Aspect Ratio: Widescreen 16:9
Click the green button to download it.
Download the 16:9 Template[/sociallocker]


