The Boston Consulting Group (BCG) growth-share matrix is a tool that helps companies figure out what to keep, sell, and invest in based on graphical representations of their products and services. Our nine style of BCG Matrix template will contribute to attractiveness of your slides and win through the fierce competition.
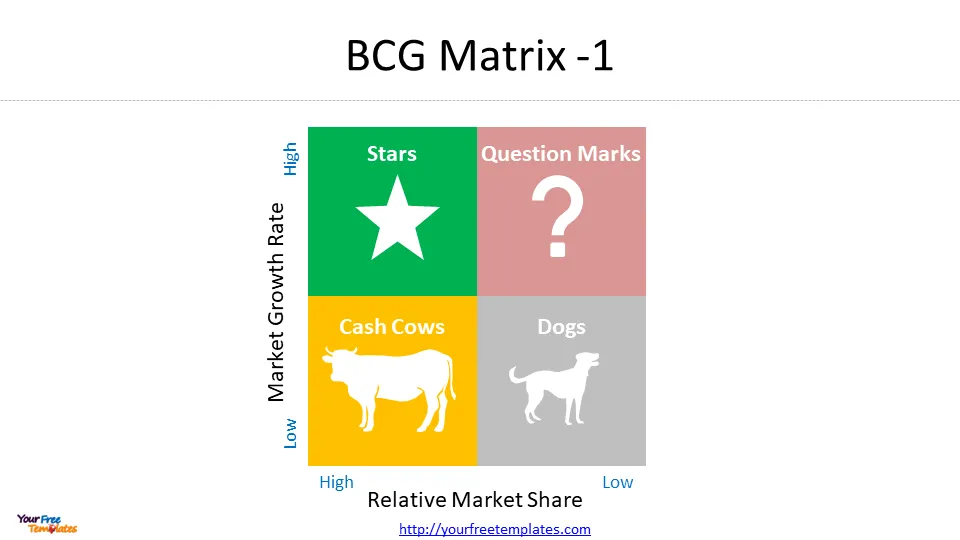
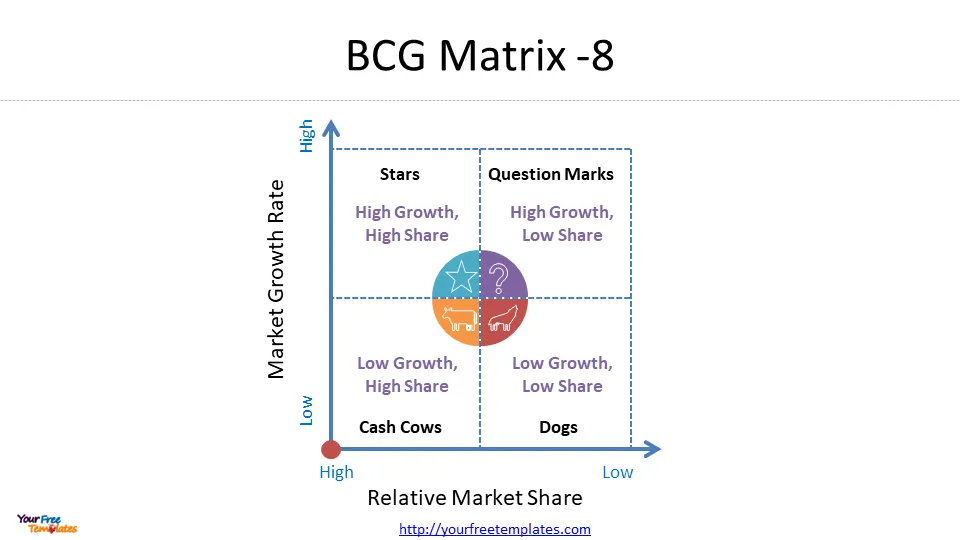
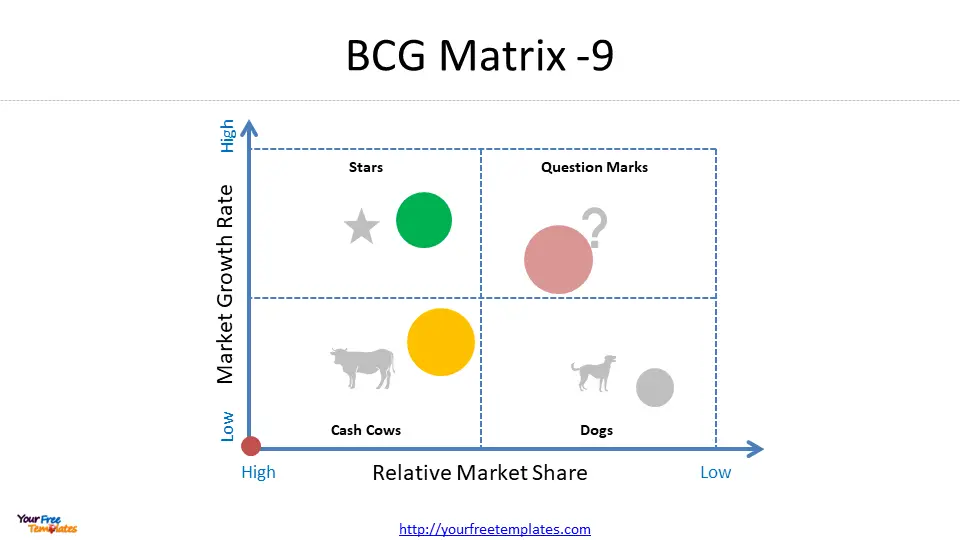
The y-axis represents market growth, and the x-axis represents market share. A four-square matrix plots the offerings of a company developed by the Boston Consulting Group in 1970.
As the same diagram PowerPoint template series, you can also find our Data Mining, marketing segment, Porter’s five forces, SWOT Analysis, Artificial Intelligence, National Diamond and BlockChain PowerPoint templates.
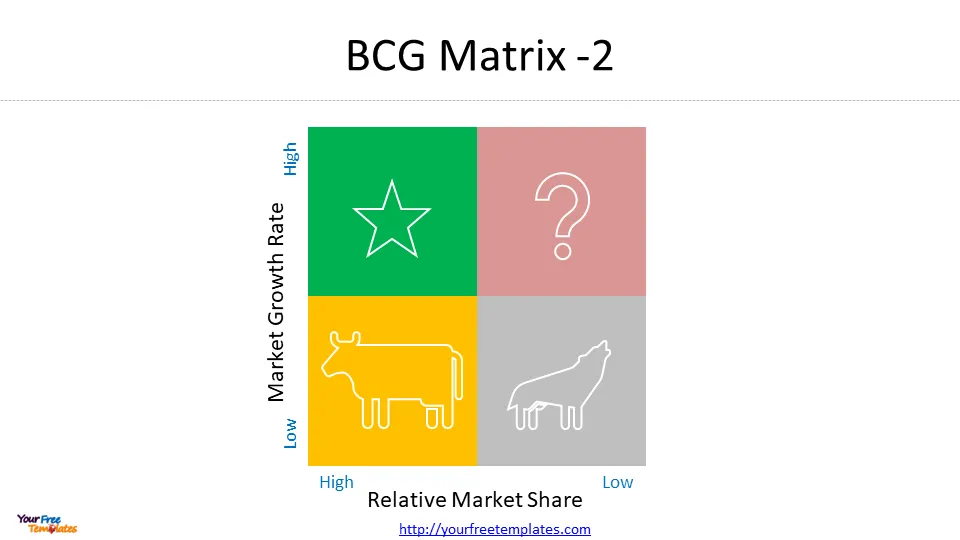
Categories of BCG Matrix (all the 9 BCG Matrix templates contain the four categories)
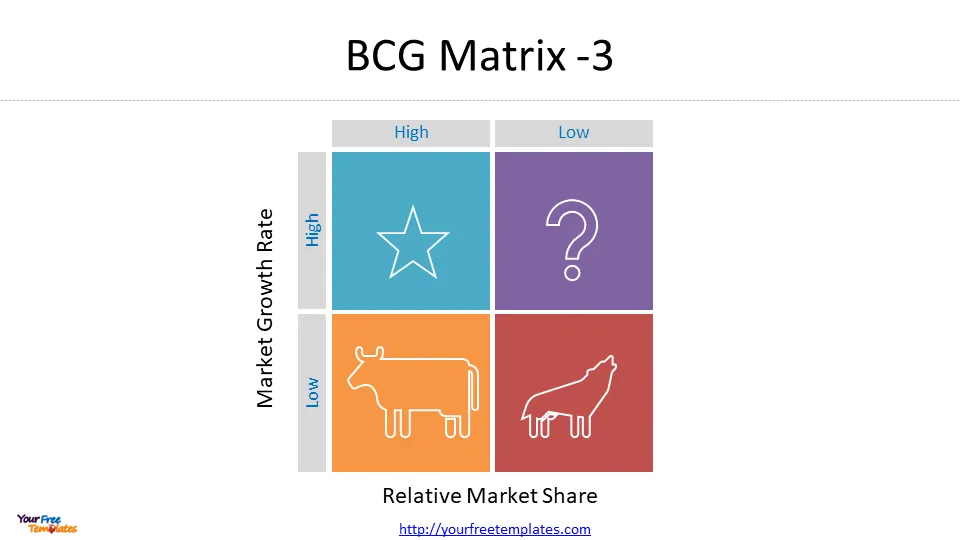
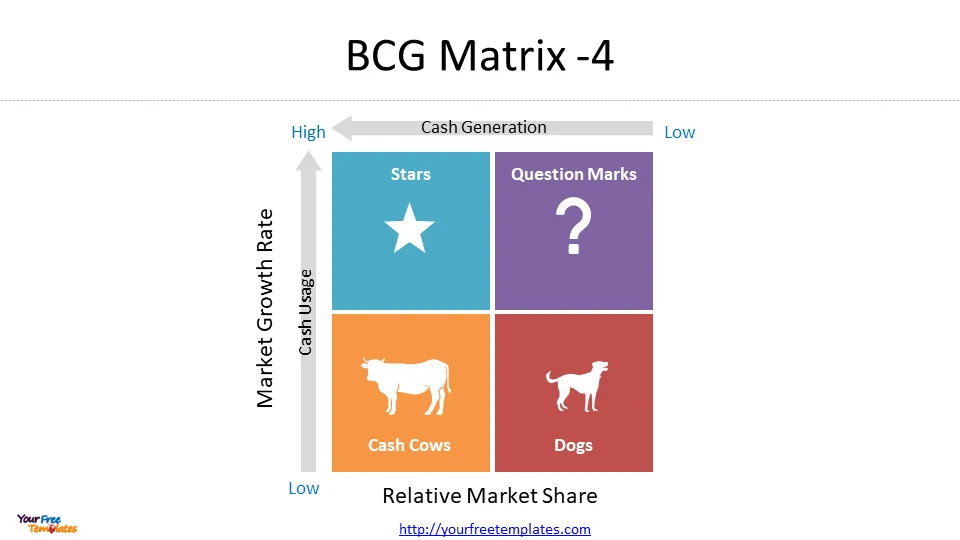
BCG’s growth-share matrix classifies products into four different categories, known heuristically as “dogs,” “cash cows,” “stars,” and “question marks.” Each category quadrant has its own unique set of characteristics that make it stand out from the others.
Dogs/Pets
The product of a company with a low market share and low growth rate is considered a “dog” and should be sold, liquidated, or repositioned. Dogs in the lower right quadrant of the grid do not generate much money because they have little market share and little to no growth. Consequently, dogs can be cash traps, tying up company funds for long periods. Therefore, they are prime candidates for divestiture.
Cash Cows
Those products whose market share is relatively large but in low-growth areas are considered “cash cows,” The company should keep milking them for as long as possible. Products in the lower left quadrant that are considered cash cows are typically leading products in mature markets.
These products typically generate higher returns than the market growth rate and can sustain themselves from a cash flow perspective for a long time. Since they produce highly predictable cash flow patterns, cash cows can be easily valued. In effect, low-growth, high-share cash cows should be milked for cash to be reinvested in high-growth, high-share “stars” with high future potential. Matrix is not a predictive tool; it cannot account for new, disruptive products at the market entry or rapid changes in consumer demand.
Stars
When a product is in a high-growth market and makes up a significant portion of that market, it is regarded as a “star” and should be invested more. Stars are in the upper left quadrant, generating high income and consuming large amounts of cash. If a star can stay a market leader, it eventually becomes a cash cow when the overall market growth rate slows.
Question Marks
The company’s questionable opportunities are those in markets with high growth rates but where it needs to maintain a significant market share. These products usually proliferate but consume a lot of company resources. Question marks are shown in the upper right corner of the grid. They should be analyzed frequently and closely to determine if they are worth maintaining.
BCG Matrix: Other Factors to Consider when categorize your product portfolio with our BCG Matrix template
As a decision-making tool, the matrix only considers some factors that companies must ultimately consider to succeed. For example, increasing the market share may be more costly than increasing revenue from additional sales, and vice versa. Companies need to plan for contingencies carefully since a product may take years to develop.
4 Quadrants of the BCG Matrix
Growth is plotted on one axis and market share on the other in a 2×2 grid. The four quadrants reflect different combinations of relative market share and growth, including:
- Low Growth, High Share. Investing in these “cash cows” will help companies raise cash for reinvestment in other areas.
- High Growth, High Share. It would be beneficial for companies to invest significantly in these “stars” since they have a high potential for the future.
- High Growth, Low Share. These “question marks” should either be invested in or discarded, depending on their chances of becoming stars.
- Low Share, Low Growth. These pets should be liquidated, divested, or repositioned by companies.
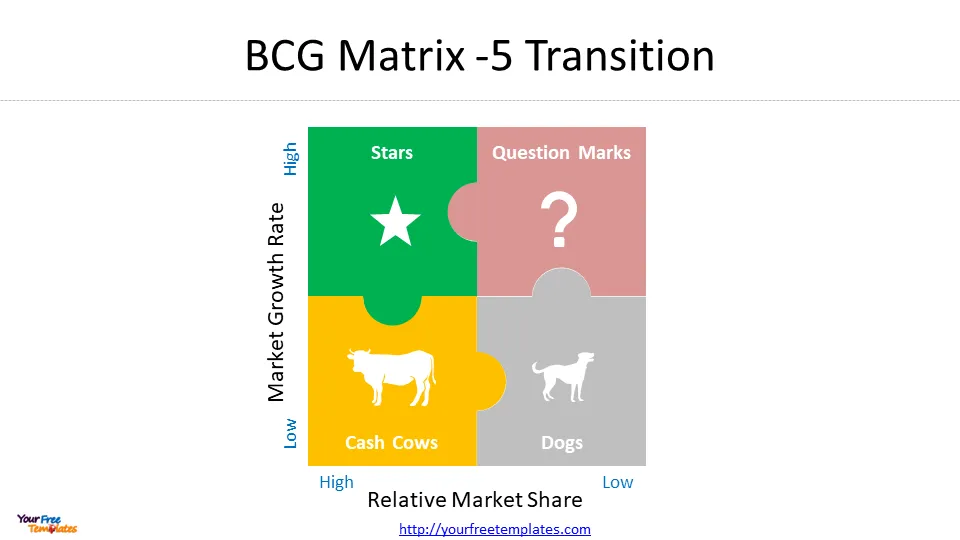
BCG Matrix: How Does It Work? BCG Matrix template can help you easily complete the job.
Using a 2×2 grid, the BCG Growth-Share Matrix evaluates a company’s growth prospects and market share via the view of its growth prospects. Each of these four categories can be assigned to a different business to determine where to invest resources and capital to create the most value.
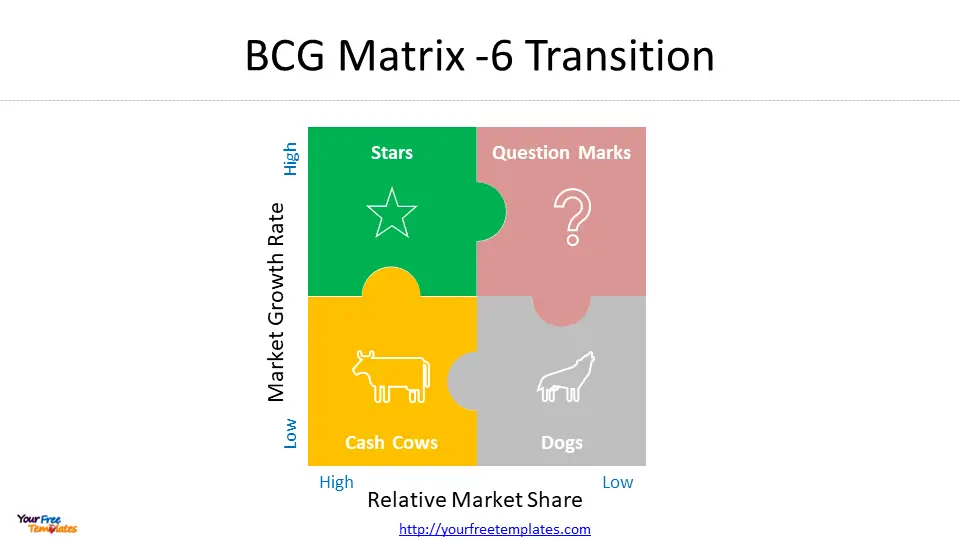
BCG Matrix: Advantages and Limitations if you want to build your one with our BCG Matrix template
Business schools use the growth-share matrix today as part of their business strategy teachings. BCG estimates that half of Fortune 500 companies used it at its peak success. Here are the pros and cons of BCG Matrix that can help you apply it in practice;
Advantages of BCG Matrix
- This approach is easy to implement and very simple to comprehend.
- It is helpful for larger companies that want to gain volume and experience its effects. It is a tool that predicts what the company will do in the future. That allows the company to determine its appropriate management strategy.
Limitations of Boston Consulting Matrix
The BCG Matrix produces a framework for allocating resources among different business units and makes it possible to compare many other business units. Despite this, the BCG matrix does have limitations; here are some of them;
- There are two levels of BCG classification for businesses: low and high. However, most businesses can also be classified as medium. It may not be possible to understand the true nature of the business in this manner.
- There’s a lot of subjective judgment involved in deciding what’s high and low.
- Managers cannot use BCG analysis to identify synergies between various SBUs within a product portfolio using BCG analysis.
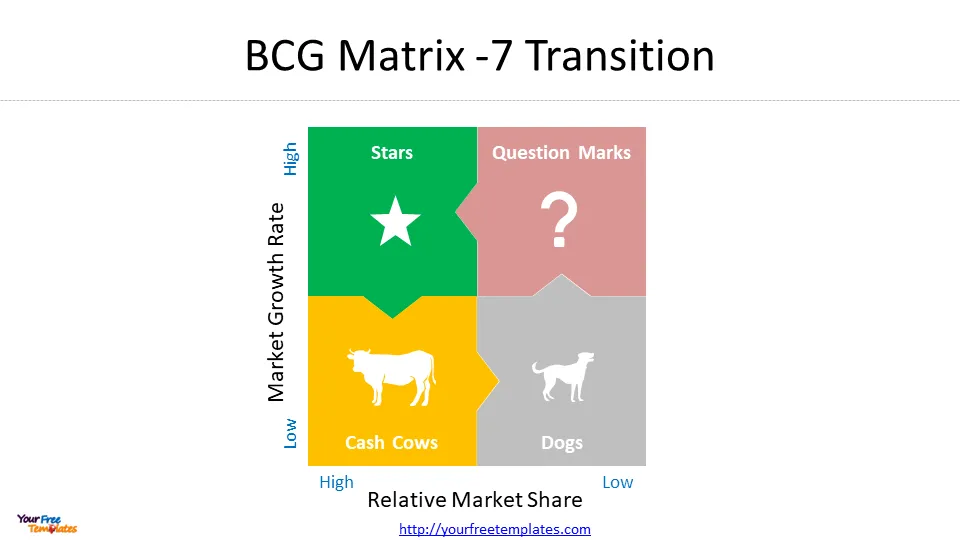
Final Words for Boston Consulting Matrix
BCG’s Growth-Share Matrix is a business management tool that helps companies determine which aspects of their business are most important and which can be shunned. Using a 2×2 table, you can categorize businesses into “stars,” “pets,” “cash cows,” and “question marks.”
With the BCG Matrix (or growth-share matrix), companies can balance investment-driven products with profit-managed products to ensure long-term revenues.
For other interesting maps, pls visit our ofomaps.com
Size:458K
Type: PPTX
[sociallocker]Aspect Ratio: Standard 4:3
Click the blue button to download it.
Download the 4:3 Template
Aspect Ratio: Widescreen 16:9
Click the green button to download it.
Download the 16:9 Template[/sociallocker]


