SUPER BOWL Powerpoint template

3,535 views

SUPER BOWL 2017 PowerPoint template has 8 slides, applying infographic skills to present Who, When, Where, Channels, Half-show. Also the reviews of historical SUPER BOWL attendances, hosted cities or regions, and appearances. 

Super Bowl 2017, our PowerPoint template for this grand event includes eight slides. 

Firstly the Super Bowl is the annual championship game of the National Football League (NFL), the highest level of professional American football in the world. Secondly the day on which the Super Bowl is played, now considered by some as an unofficial American national holiday, is called “Super Bowl Sunday”. It is the second-largest day for U.S. food consumption, after Thanksgiving Day.

2017 SUPER BOWL LI PowerPoint template is our Infographic Event Series. It is to provide some ideas on how to apply infographic skills to present your slides for events.  An event includes 6 aspects, namely, participants (who), date (when), location (where), half-time show (who), media (how), and reviews (analysis). So every item will be the key point of a slide. Furthermore you need a contents slide to give the audience the whole picture, for what you will say for the SUPER BOWL 51.

Generally Infographic slides encourage using more graphics and less words.

Principle 1, it is impacting to use logos rather than texts to represent Super Bowl teams. 

As for teams competing for super bowl 51 championship, we find the logos of The New England Patriots and Atlanta Falcons from www.sportslogos.net, a wonderful resource for logos of SUPER BOWL teams. So we recommended to provide the website links beside the logos, so the interested can explore more in those websites.

It is also the same for companies or organizations; we use logos to replace the names of companies, achieving visual effects. For the authoritative source of logo, it is very common to get it from the official website of the organization or the company. An alternative way is from third-party source, like sports logos. One thing should be bear in mind is the copyright of logos, the application terms for the logos.

We used the skill in this PowerPoint template for 3 slides, “who will play in SUPER BOWL?”, “Channels for the SUPER BOWL”, and “SUPER BOWL Appearances Review, 1967-2017”.
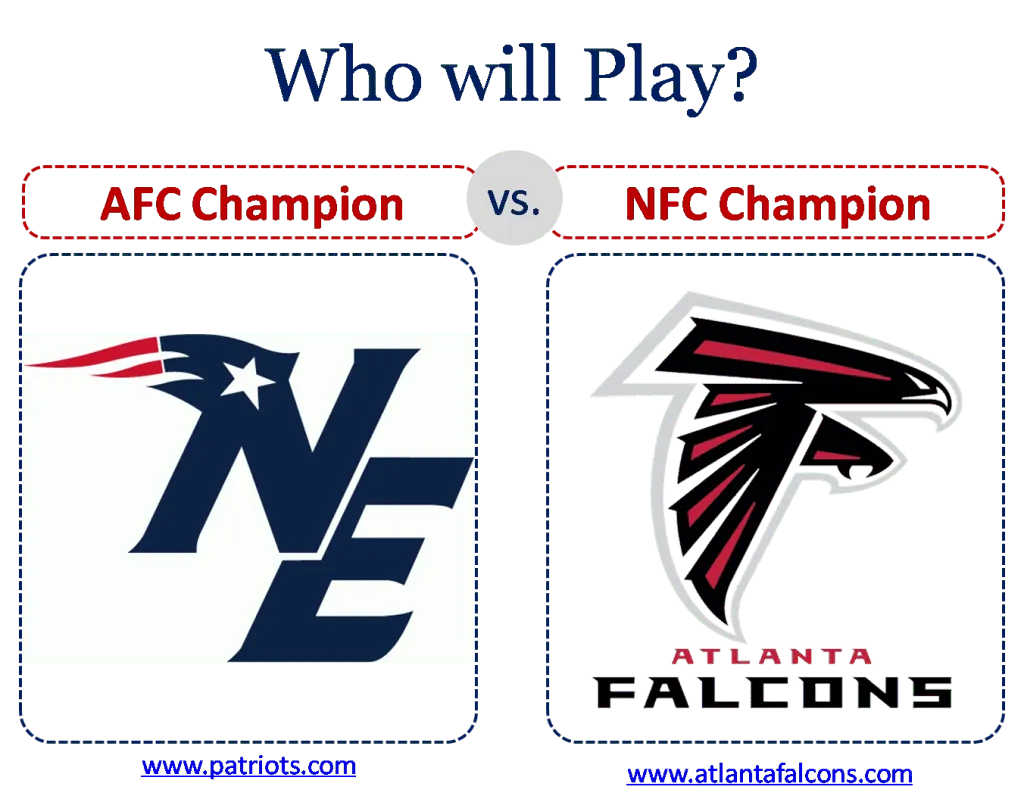
Super Bowl 2017 PowerPoint template teams with logos

2017 Super Bowl Channels in PowerPoint template

Super Bowl Appearances Review in PowerPoint template

Principle 2, it is eye-catching to apply editable maps rather than map images to show locations or label cities in PowerPoint template.

Super Bowl 51 will take place at NRG Stadium in Houston, home of the Texans. How to present the location of Super Bowl 51 in a vivid way? For slide 5, it is appropriate to use an outline map of Texas State and label the location of Huston city. You can fill the outline map  with color matching with the whole deck. You can place the text box location  within or the outside the outline of the state. As for street view, Google maps can play a role in street view. Search the Google maps with your address, then Print Screen to get the screenshot, finally tailor the image and decorate it.

.
2017 Super Bowl location with outline map and Google map in PowerPoint template

In slide “Host cities/region Review, 1967-2021”, the United States political map template is used to show the locations of host cities for Super Bowl. It is very interesting to show the number of host from 1967 to present for those locations. Bubble chart is better than digits to demonstrate the total numbers.

Resources as followed for PowerPoint template.

So How to get map templates for your PPTs? Yes, there are plenty of sources in the web to provide free county and subdivision outline or political maps. We highly recommend www.editablemaps.com for tons of cost-effective premium maps available for your selection and customize maps for specific project or our website https://yourfreetemplates.com with totally free outline maps or political ones ready for use. Please give your accredit by giving a link like maps from https://yourfreetemplates.com.

uper Bowl Host cities/region Review from 1967 to 2021 in PowerPoint template

Principle 3, it is convincing to use charts rather than qualitative analysis texts to get conclusions.

Because Super Bowl 2017 or Super Bowl 51 will take place Sunday, Feb. 5 and kick off at 6:30 p.m. ET. So In Slide “When and What time?” . Firstly Calendar can be used to highlight the day with special meaning. The calendar 2017 PowerPoint template is ready for you in https://yourfreetemplates.com under the category of MISC. You can change the color of other dates into grey just highlight the 5th in red. The 6:30 time icon is also easy to draw, as you see from this template. Secondly the rounded rectangle, circle can be selected from the shapes to the clock dial. Lines with different width are used for hour hand, minute hand and second one.
Super Bowl 2017 date with calendar chart in PowerPoint template

In PowerPoint template Slide “Attendance Review, 1967-2016”, we used line charts to show the peaks and valleys of annual number of Attendance. Since the total attendance is dependent on the capacity of the stadium. We found Rose Bowl from Pasadena, California with the most attendance for Super Bowl; there are four times of 100,000+ attendances for this stadium. The Rose Bowl’s maximum stated seating capacity was 104,091 from 1972 to 1997.

Historical review and future outlook.

The other 100,000+ attendance game came at Cowboys Stadium at Super Bowl XLV in 2011, between the Green Bay Packers and Pittsburgh Steelers when 103,219 watched the game. The maximum capacity of the stadium with standing room is 105,000. The lowest attended Super Bowl game was Super Bowl I, which happened in 1967, taking place at the Los Angeles Memorial Coliseum, which had an attendance of 61,946. It is very disappointing considering the maximum capacity of over 100,000 at the time. As for the 2017 Super Bowl, NRG Stadium has a seating capacity of 71,795. So we can estimate the attendances of 2017.
Super Bowl Attendance Review from 1967 to 2016 in PowerPoint template

The host cities.

You can see in PowerPoint template Slide “Host cities/region Review, 1967-2021” showed above,  based on the size of the bubbles. As of Super Bowl 50, 27 of 50 Super Bowls have took place in three cities. They are New Orleans (ten times), the Greater Miami area (ten times), and the Greater Los Angeles area (seven times).

Traditionally, the NFL does not award Super Bowls to stadiums that are located in cold climates. That is with an expected average daily temperature less than 50 °F (10 °C) on game day. Unless the field can be completely covered by a fixed or retractable roof. Five Super Bowls have took place in northern cities. There are two in the Detroit area, one in Minneapolis, one in Indianapolis, and one in the New York area. A sixth Super Bowl will happen in a northern city. As Minneapolis will become the host of Super Bowl LII in 2018 in the roofed U.S. Bank Stadium.

The odds.

You can be easily conclude from PowerPoint template Slide “SUPER BOWL Appearances Review, 1967-2017″. The four-time championship winner Patriots remain the favorites to win the Super Bowl in 2017.

If you are a fan of Lady Gaga, then you don’t want to miss the Super Bowl 2017 on 5th Feb, 2017. The popular singer has confirmed to participate in the half-time show. Enjoy the beautiful music for the celebrity.

2017 Super Bowl Half-Time Show

Size: 1150K
Type: PPTX

Aspect Ratio: Standard 4:3
Click the blue button to download it.
Download the 4:3 Template