Exploring the World Map Outline: A Guide to Mercator, Robinson, Goode’s Homolosine, Gall-Peters, Mollweide, Sinusoidal and Winkel Tripel Projections. You can learn World outlines through our ready-made 7 slides for those projections and download them at the end of the blog.
As a geography enthusiast, I’ve always been fascinated by the world map outline. It’s the most basic representation of our planet, and yet it can convey so much information. However, not all maps are created equal. Different map projections can distort the size, shape, or distance of land masses and oceans, depending on the purpose and methods of the mapmaker. In this article, I’ll introduce you to some of the most popular and controversial map projections, including the Mercator Projection, the Robinson Projection, and the Goode’s Homolosine Projection etc., and explain their history, characteristics, and uses. By the end of this guide, you’ll have a better understanding of how to choose the right world map outline projection for your needs.
What is a map projection?
Before we dive into the specific types of map projections, let’s clarify what a map projection is. Simply put, a map projection is a method of transforming a spherical or ellipsoidal surface (such as the earth) onto a two-dimensional plane (such as a piece of paper or a computer screen). Since the earth is not flat, any attempt to represent it on a flat surface will involve some degree of distortion. Map projections can distort various aspects of the earth’s surface, such as its shape, area, distance, direction, or scale. Therefore, different map projections are designed for different purposes, such as navigation, education, research, or propaganda.
Mercator Projection – history, characteristics, and uses
The Mercator Projection is perhaps the most well-known and criticized world map outline projection. It was invented by the Flemish cartographer Gerardus Mercator in 1569, and was widely used by European navigators during the Age of Discovery. The Mercator Projection is a cylindrical projection, which means that the earth is wrapped around a cylinder and projected onto a flat surface. The result is a map that preserves the direction of all lines, but distorts the size and shape of land masses and oceans, especially near the poles. The Mercator Projection also exaggerates the size of Europe and North America, while minimizing the size of Africa and South America. This distortion has been criticized as Eurocentric and colonial, since it reflects the geopolitical interests and biases of the time.
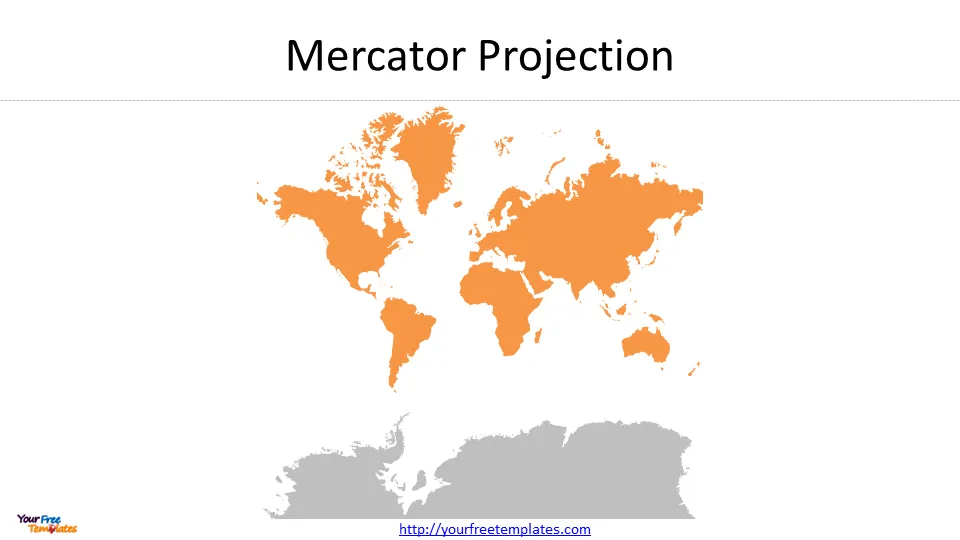
Despite its drawbacks, the Mercator Projection has some advantages. It is still used for navigation and aviation, since it preserves the direction of any straight line on the earth, which is essential for calculating courses and bearings. The Mercator Projection is also useful for world maps that need to show the entire globe with minimal distortion, such as wall maps or classroom maps. However, the Mercator Projection is not suitable for maps that need to show the actual size or shape of land masses and oceans, such as thematic maps or political maps.
Robinson Projection – history, characteristics, and uses
The Robinson Projection is a compromise between the cylindrical and conical projections, and was first presented by Arthur H. Robinson in 1961. The Robinson Projection is a pseudocylindrical projection, which means that it combines elements of both cylindrical and conical projections to minimize the distortion of various aspects of the earth’s surface. The Robinson Projection is neither conformal (preserving angles) nor equal-area (preserving areas), but tries to balance both characteristics. The result is a map that is visually appealing and easy to read, with less distortion near the poles and the equator. The Robinson Projection is often used for general-purpose world maps, such as in atlases, textbooks, or online maps.
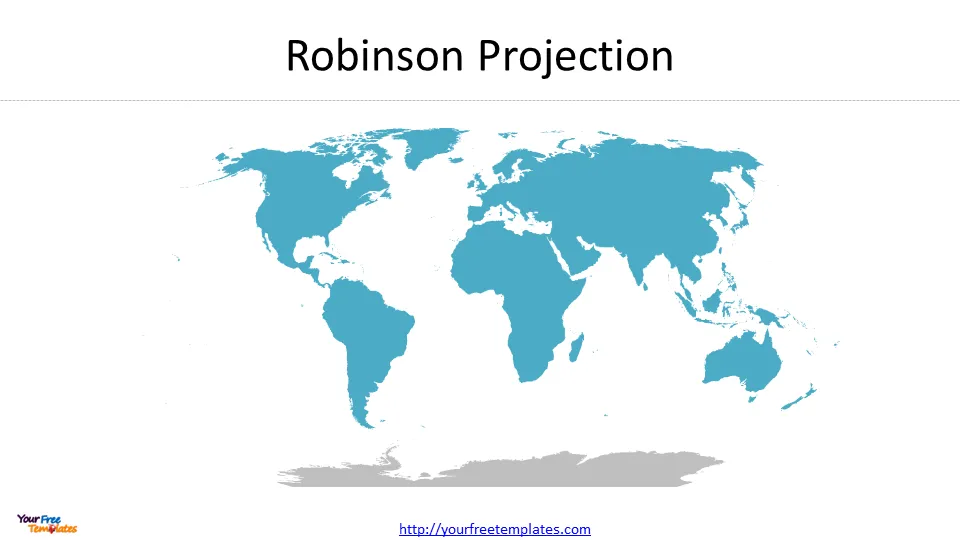
The Robinson Projection has both advantages and disadvantages. Even though, it is a compromise projection that tries to balance various factors, such as visual appeal, readability, and accuracy. The Robinson Projection is not as precise as some other projections in preserving angles or areas, and can still distort the shape or size of some land masses or oceans. Therefore, the Robinson Projection is a good choice for maps that need to show the world as a whole, but may not be suitable for maps that need to show specific regions or themes.
Goode’s Homolosine Projection – history, characteristics, and uses
The Goode’s Homolosine Projection, also known as the Interrupted Goode Homolosine Projection or the Butterfly Projection, was invented by John Paul Goode in 1923. The Goode’s Homolosine Projection is an equal-area projection, which means that it preserves the relative size of land masses and oceans, but sacrifices some other aspects, such as shape, distance, or direction. The Goode’s Homolosine Projection is unique in that it splits the earth’s surface into two hemispheres, each with its own projection, and then combines them into a single map. The result is a map that minimizes the distortion of land masses and oceans, while also showing the interruptions caused by the projections. The Goode’s Homolosine Projection is often used for thematic maps that need to show the distribution of data or phenomena, such as climate, population, or natural resources.
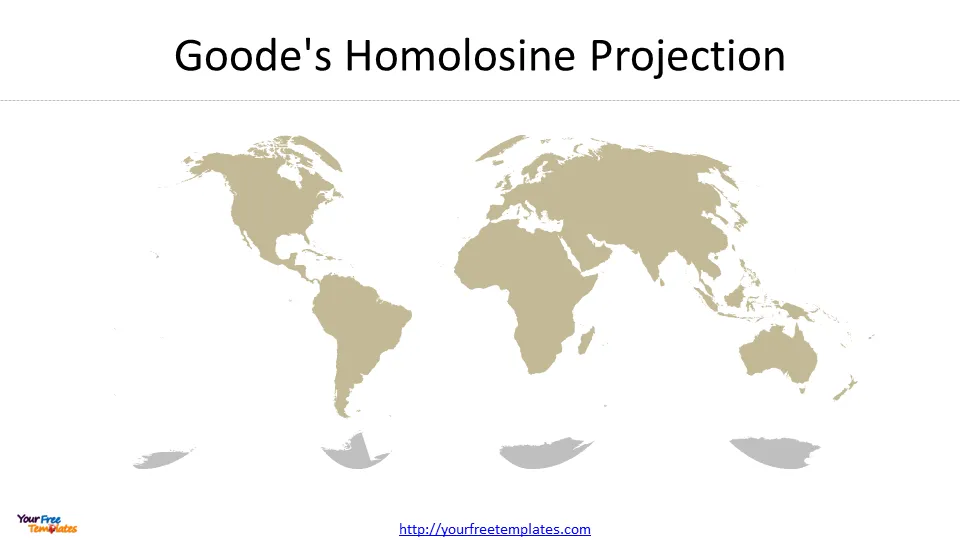
The Goode’s Homolosine Projection has pros and cons. It is an equal-area projection that preserves the relative size of land masses and oceans, which is important for many types of maps. However, it can be difficult to read and interpret, since it breaks the continuity of the earth’s surface and introduces interruptions and distortions. Therefore, the Goode’s Homolosine Projection is a good choice for maps that need to show the distribution of data or phenomena on a global scale, but may not be suitable for maps that need to show the actual shape or distance of regions.
Gall-Peters Projection- history, characteristics, and uses
The Gall-Peters Projection, also called the Peters Projection or the Equal-Area Cylindrical Projection, was invented by Arno Peters in 1973, as a response to the Mercator Projection’s distortion of land masses and oceans. The Gall-Peters Projection is an equal-area projection, which means that it preserves the relative size of land masses and oceans, but sacrifices some other aspects, such as shape, distance, or direction. The Gall-Peters Projection is a cylindrical projection, like the Mercator Projection, but with a different scaling factor that gives more weight to the equator and less to the poles. The result is a map that shows the actual size of land masses and oceans, but distorts their shape and direction. The Gall-Peters Projection has been praised by some as a more accurate and fair representation of the world, especially for political or social purposes.
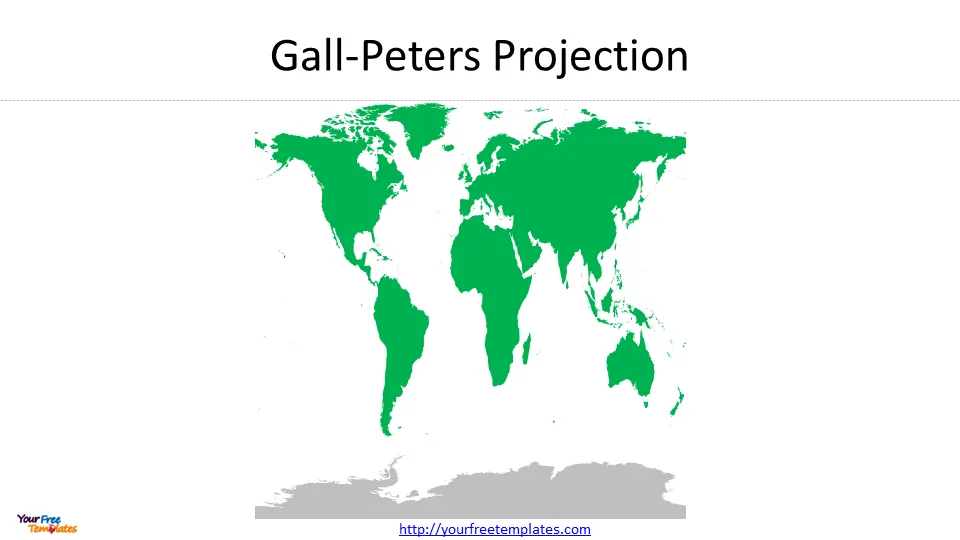
The Gall-Peters Projection has some benefits and disadvantages. Although it is an equal-area projection that corrects the Mercator Projection’s distortion of land masses and oceans, which is important for many types of maps, it can introduce new distortions of shape and direction, and may not be as visually appealing or easy to read as other projections. Therefore, the Gall-Peters Projection is a good choice for maps that need to show the actual size or distribution of land masses and oceans, especially for political or social purposes, but may not be suitable for maps that need to show the actual shape or distance of regions.
Mollweide Projection- history, characteristics, and uses
The Mollweide Projection, also named the Homolographic or Homalographic Projection, was invented by Karl Mollweide in 1805. The Mollweide Projection is an equal-area projection, which means that it preserves the relative size of land masses and oceans, but sacrifices some other aspects, such as shape, distance, or direction. The Mollweide Projection is an elliptical projection, which means that the earth is projected onto an ellipse instead of a circle or a rectangle. The result is a map that is visually striking and easy to recognize, with less distortion near the equator and more near the poles. The Mollweide Projection is often used for scientific or thematic maps that need to show the distribution of data or phenomena, such as climate, geology, or astronomy.
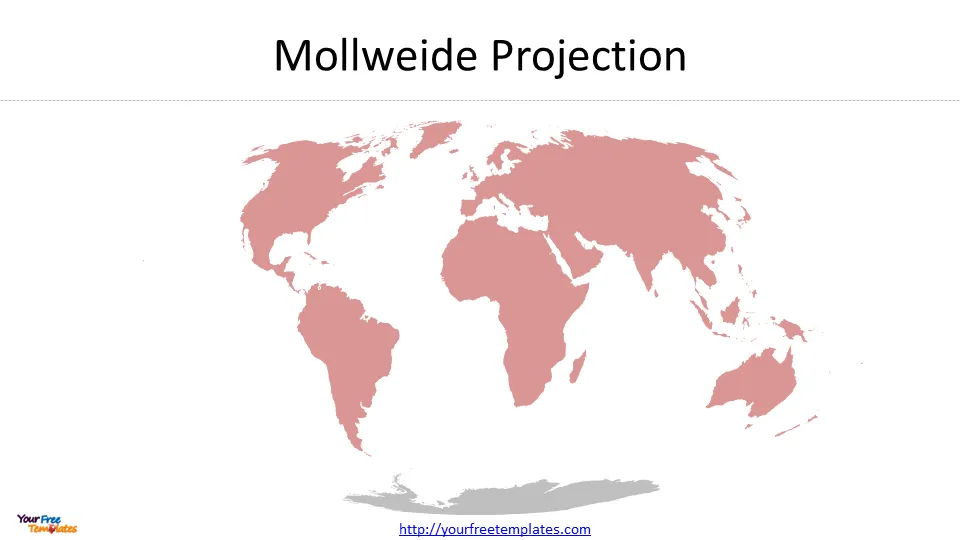
The Mollweide Projection has positive and negative points. Even though it is an equal-area projection that preserves the relative size of land masses and oceans, which is important for many types of maps; It can introduce new distortions of shape and direction, and may not be as accurate or precise as other projections. Therefore, the Mollweide Projection is a good choice for maps that need to show the distribution of data or phenomena on a global scale, but may not be suitable for maps that need to show the actual shape or distance of regions.
Sinusoidal Projection- history, characteristics, and uses
The Sinusoidal Projection, otherwise called the Sanson-Flamsteed or Mercator Equal-Area Projection, was first presented by Nicolas Sanson in 1657. The Sinusoidal Projection is an equal-area projection, which means that it preserves the relative size of land masses and oceans, but sacrifices some other aspects, such as shape, distance, or direction. The Sinusoidal Projection is a cylindrical projection, similar to the Mercator Projection, but with a different scaling factor that gives more weight to the equator and less to the poles. The result is a map that shows the actual size of land masses and oceans, but distorts their shape and direction. The Sinusoidal Projection is often used for educational or research purposes, as well as for thematic maps that need to show the distribution of data or phenomena.
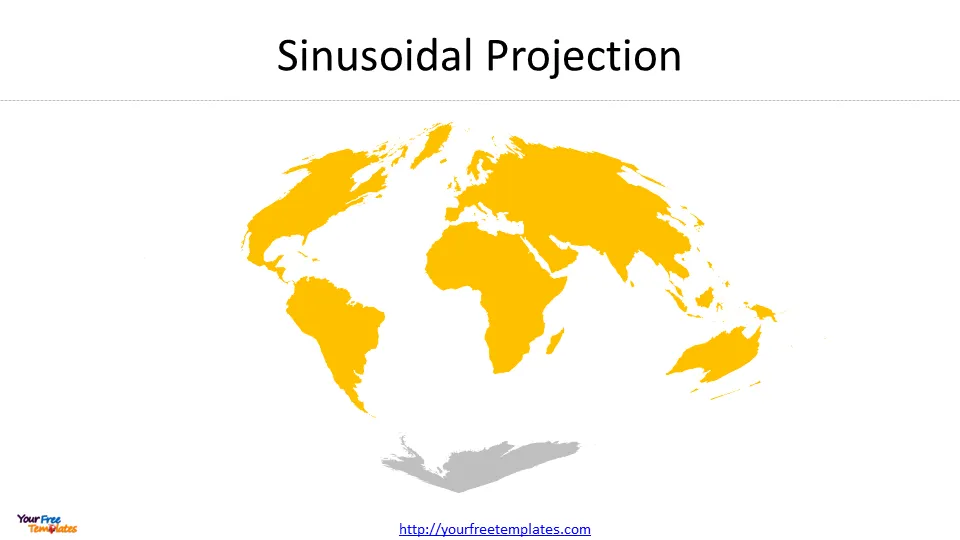
The Sinusoidal Projection has for and against arguments. It is an equal-area projection that corrects the Mercator Projection’s distortion of land masses and oceans, which is important for many types of maps. But it can introduce new distortions of shape and direction, and may not be as visually appealing or easy to read as other projections. Therefore, the Sinusoidal Projection is a good choice for maps that need to show the actual size or distribution of land masses and oceans, especially for educational or research purposes, but may not be suitable for maps that need to show the actual shape or distance of regions.
Winkel Tripel Projection- history, characteristics, and uses
The Winkel Tripel Projection, also known as the Modified Aitoff Projection, was invented by Oswald Winkel in 1921, and later modified by Heinrich C. Tripel in 1996. The Winkel Tripel Projection is a compromise projection, similar to the Robinson Projection, that tries to balance various factors, such as visual appeal, readability, and accuracy. The Winkel Tripel Projection is neither conformal (preserving angles) nor equal-area (preserving areas), but tries to balance both characteristics. The result is a map that is visually pleasing and easy to read, with less distortion near the poles and the equator. The Winkel Tripel Projection is often used for general-purpose world maps, such as in atlases, textbooks, or online maps.
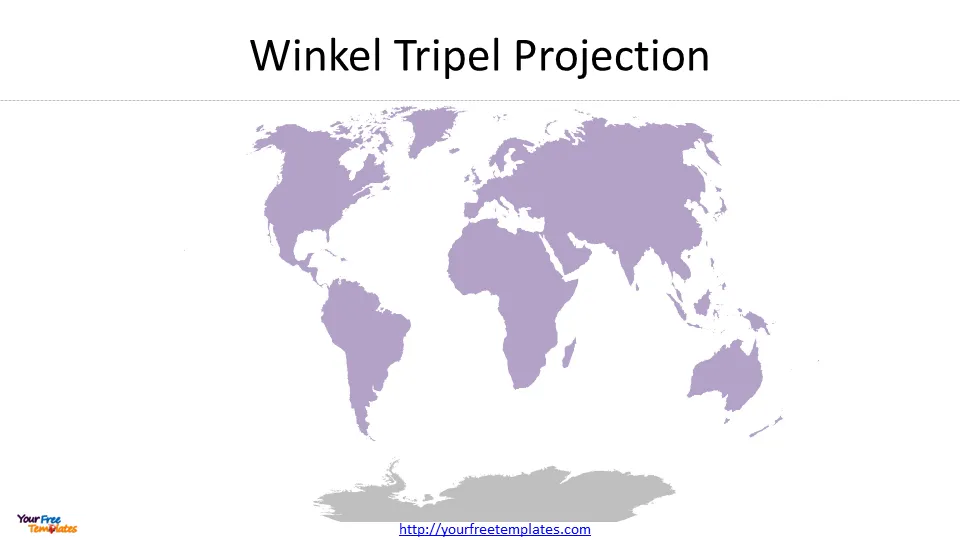 The Winkel Tripel Projection has some for and against arguments. Since it is a compromise projection that tries to balance various factors, such as visual appeal, readability, and accuracy. But it is not as precise as some other projections in preserving angles or areas, and can still distort the shape or size of some land masses or oceans. Therefore, the Winkel Tripel Projection is a good choice for maps that need to show the world as a whole, but may not be suitable for maps that need to show specific regions or themes.
Differences between the seven projections
Now that we’ve explored the history, characteristics, and uses of seven popular map projections, let’s compare them to see how they differ from each other. The main differences between the seven projections can be summarized as follows:
- Mercator Projection: preserves direction, distorts size and shape, good for navigation, Eurocentric bias
- Robinson Projection: balances size and shape, easy to read, good for general-purpose maps, compromises accuracy
- Goode’s Homolosine Projection: preserves area, minimizes distortion, shows interruptions, good for thematic maps, breaks continuity
- Gall-Peters Projection: preserves area, corrects distortion, shows actual size, good for political or social purposes, introduces new distortions
- Mollweide Projection: preserves area, elliptical shape, visually striking, good for scientific or thematic maps, sacrifices accuracy
- Sinusoidal Projection: preserves area, cylindrical shape, corrects distortion, good for education or research, sacrifices readability
- Winkel Tripel Projection: balances size and shape, visually pleasing, compromises accuracy, good for general-purpose maps.
Advantages and disadvantages of each projection
Each of the seven map projections we’ve discussed has its own pros and cons, depending on the purpose and context of the map. Here’s a summary of the pros and cons of each projection:
- Mercator Projection: pros – preserves direction, good for navigation, shows entire world; cons – distorts size and shape, Eurocentric bias, not suitable for thematic maps.
- Robinson Projection: pros – balances size and shape, easy to read, good for general-purpose maps; cons – compromises accuracy, not suitable for specific themes or regions.
- Goode’s Homolosine Projection: pros – preserves area, minimizes distortion, shows interruptions, good for thematic maps; cons – breaks continuity, sacrifices accuracy, not visually appealing.
- Gall-Peters Projection: pros – preserves area, corrects distortion, shows actual size, good for political or social purposes; cons – introduces new distortions, sacrifices shape and direction, not widely used.
- Mollweide Projection: pros – preserves area, visually striking, good for scientific or thematic maps; cons – sacrifices accuracy, not suitable for navigation or detailed maps.
- Sinusoidal Projection: pros – preserves area, corrects distortion, good for education or research; cons – sacrifices readability, not visually appealing, introduces new distortions.
- Winkel Tripel Projection: pros – balances size and shape, visually pleasing, compromises accuracy, good for general-purpose maps; cons – not as precise as other projections, sacrifices accuracy.
How to choose the right projection for your needs
So, how do you choose the right world map outline projection for your needs? The answer depends on several factors.
Choosing the right map projection can be a complex and challenging task. The projection of a map can impact how accurate and useful it is for a given purpose.
The first step in choosing the right map projection is to understand the purpose of the map. Are you creating a map for navigation or for visualizing data?
The next step is to consider the area of the world you are mapping. Different map projections work better for different regions, depending on the shape and size of the continent or country. For example, the Mercator projection is useful for navigation because it preserves the direction but distorts the size of landmasses. On the other hand, the Robinson projection is useful for visualizing data because it balances distortion across the entire map.
It’s also important to consider the scale of the map and the level of detail required. By taking these factors into account, you can choose the map projection that best suits your needs.
For other interesting maps, pls visit our ofomaps.com
Size:1776K
Type: PPTX
Aspect Ratio: Standard 4:3
Click the blue button to download the maps.
Download the 4:3 Template
Aspect Ratio: Widescreen 16:9
Click the green button to download the maps.
Download the 16:9 Template


![Digital Marketing: Opportunity, Strategy, and Action Digital marketing is search engine optimization (SEO), search engine marketing (SEM), content marketing, influencer marketing, content automation, campaign marketing, data-driven marketing,[8] e-commerce marketing, social media marketing, social media optimization, e-mail direct marketing, Display advertising, e–books.](https://yourfreetemplates.com/wp-content/uploads/2019/08/Digital_marketing_1-100x70.gif)


