Analyzing market share is crucial for businesses to understand their competitive position. RMS market share, or relative market share, offers valuable insights into a company’s standing within its industry. This metric compares a firm’s market share to that of its largest competitor, providing a clear picture of its market strength and potential for growth.
To analyze RMS market share effectively, companies use tools like the ROS/RMS Matrix. This matrix helps to evaluate the relationship between return on sales (ROS) and relative market share. By conducting an RMS analysis, businesses can identify their market position, assess competitive advantages, and make informed strategic decisions. This article will explore the concept of relative market share, explain the ROS/RMS Matrix, and guide readers through the process of performing and applying RMS market share analysis.
At the end of this post, you can download our rms market share PowerPoint template to fit your purpose. As the same diagram PowerPoint template series, you can also find our Energy-as-a-Service, the impact of climate change on international business strategies, Blockchain in Renewable Energy, SPACE Matrix, Bowman’s Strategy Clock, Value Chain Analysis, Climate Change, Carbon Neutral Meaning, Renewable Energy Sources, Generative AI, Circular Economy, Blue Sea Strategy, 2025 Calendar with Holidays, The 7 Habits of Highly Effective People, Six Thinking Hats, Pareto Chart, Occam’s Razor, Data Mining, marketing segment, Porter’s five forces, SWOT Analysis, GE Matrix, BCG Matrix, Artificial Intelligence, National Diamond and BlockChain PowerPoint templates.
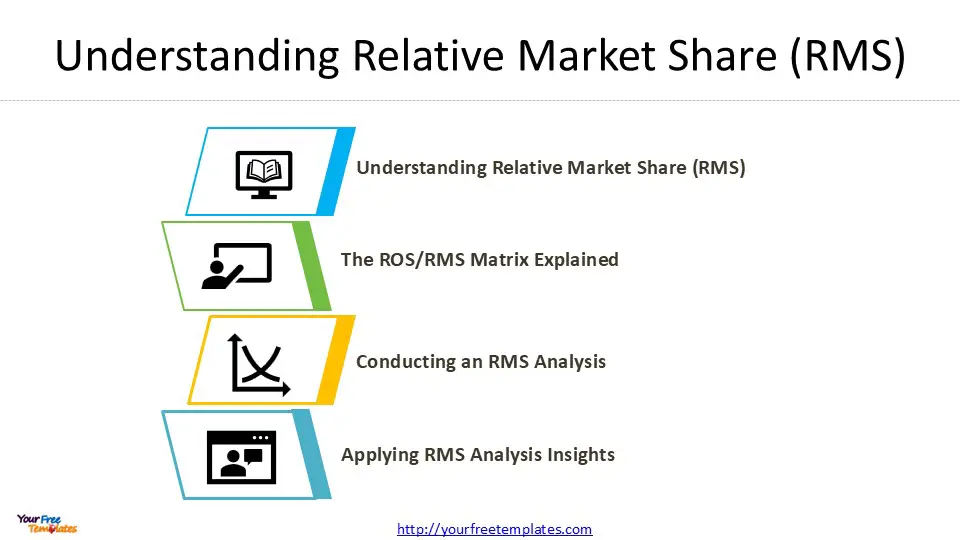
Understanding Relative Market Share (RMS)
Definition and importance of RMS
Relative Market Share (RMS) is a crucial metric that helps companies assess their position in the market compared to their leading competitors. This measure offers valuable context to a company’s absolute market share, allowing businesses and investors to gage their performance relative to the biggest players in their industry. RMS is particularly useful for making strategic decisions aimed at increasing sales and enhancing market presence.
The importance of RMS lies in its ability to provide a clear picture of a company’s standing within its competitive landscape. By comparing a firm’s market share to that of its largest rival, RMS offers insights that go beyond simple market share percentages. This metric helps businesses identify major players in their industry and understand their own position relative to these key competitors.
Calculating RMS for market leaders and other companies
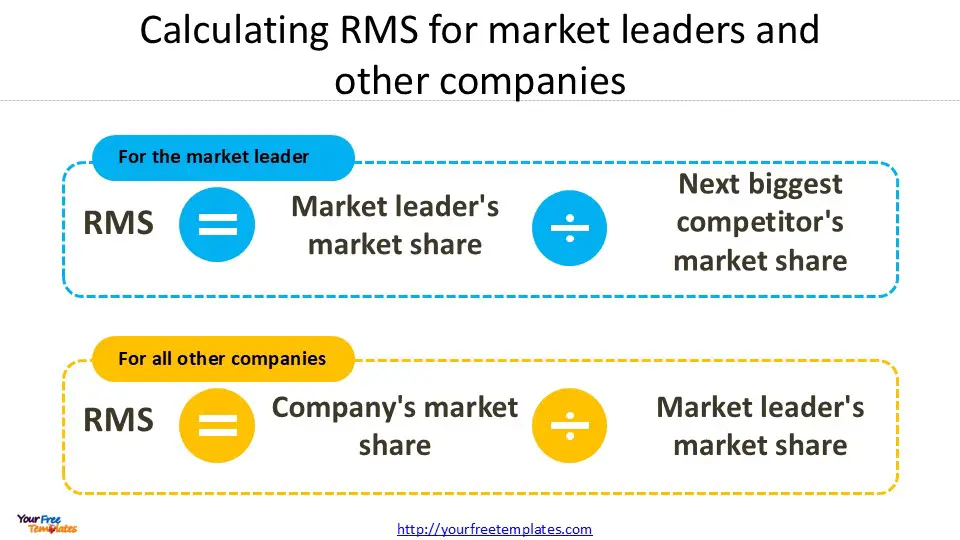
The calculation of RMS differs slightly for market leaders and other companies. For the market leader, the formula is:
RMS = Market leader’s market share / Next biggest competitor’s market share
For all other companies, the equation is:
RMS = Company’s market share / Market leader’s market share
To illustrate, let’s consider an example where the market leader has a 40% market share, and the next largest competitor holds 30%. The market leader’s RMS would be 1.33 (40% divided by 30%). For a company with a 30% market share, its RMS would be 0.75 (30% divided by 40%).
These calculations provide a normalized view of a company’s market position, allowing for more meaningful comparisons across different industries and market sizes.
Relationship between RMS and profitability
Research has shown a significant positive correlation between relative market share and profitability. Studies, including the PIMS study by Buzzell, Gale, and Sultan, have demonstrated this relationship empirically 1. The underlying theory often cited is the experience curve effect, formulated by the Boston Consulting Group (BCG).
As companies gain larger market shares, they often experience economies of scale, which can lead to increased profitability. This relationship is often visualized using a chart with RMS on the x-axis and a profitability measure, such as return on assets (ROA), on the y-axis. Such charts typically show a strong positive correlation between these two variables 2.
However, it’s important to note that this relationship is not always perfectly linear. Some studies have shown that while share leadership used to be a strong predictor of profitability leadership, the growing complexity of business has introduced other factors that influence profitability beyond just economies of scale 3.
In some markets, companies can succeed at either end of the RMS spectrum. Niche players with lower RMS can be profitable by focusing on specific market segments, while market leaders benefit from their scale. The challenge often lies in the middle ground, where companies may struggle to define their market position effectively.
Understanding the relationship between RMS and profitability is crucial for businesses when formulating strategies for growth and market positioning. It helps companies decide whether to pursue increased market share or focus on niche markets, depending on the specific dynamics of their industry.
The ROS/RMS Matrix Explained
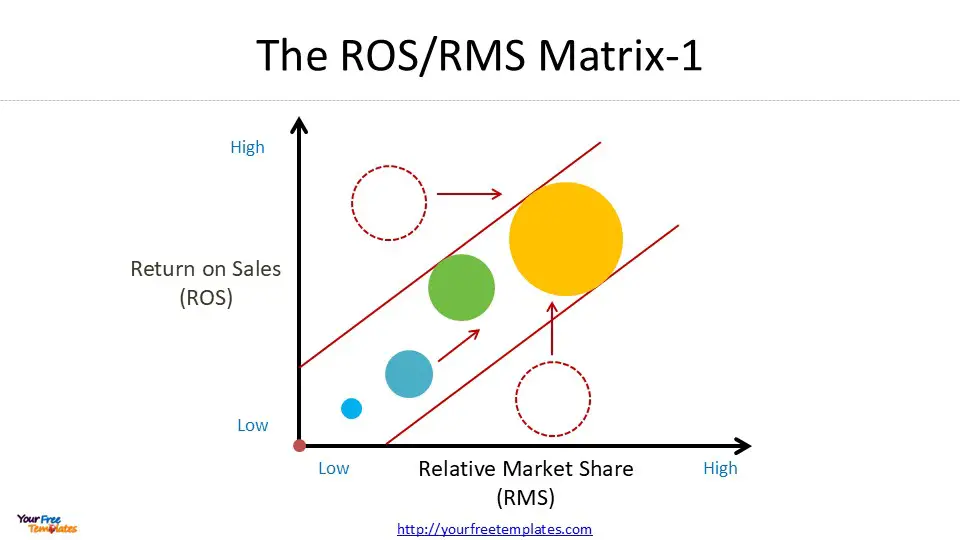
The ROS/RMS Matrix is a powerful tool for analyzing market share and profitability. This visual representation helps businesses understand their position relative to competitors and make informed strategic decisions.
Components of the matrix: RMS, Return on Sales (ROS), and sales volume
The matrix consists of three key components:
- Relative Market Share (RMS): Plotted on the x-axis, RMS compares a company’s market share to that of its largest competitor. For market leaders, RMS is calculated by dividing their market share by the next biggest competitor’s share. For other companies, it’s their market share divided by the market leader’s share.
- Return on Sales (ROS): Represented on the y-axis, ROS measures a company’s operating efficiency. It’s calculated by dividing operating profit by net sales revenue, showing how much profit is generated per dollar of sales.
- Sales Volume: Depicted by the size of bubbles in the matrix, this reflects each company’s annual sales or net income.
Interpreting the matrix quadrants
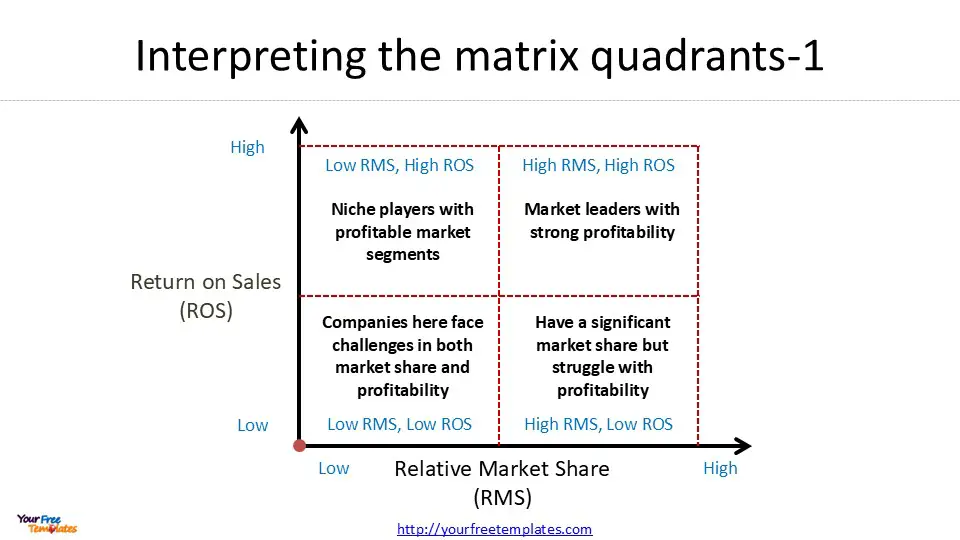
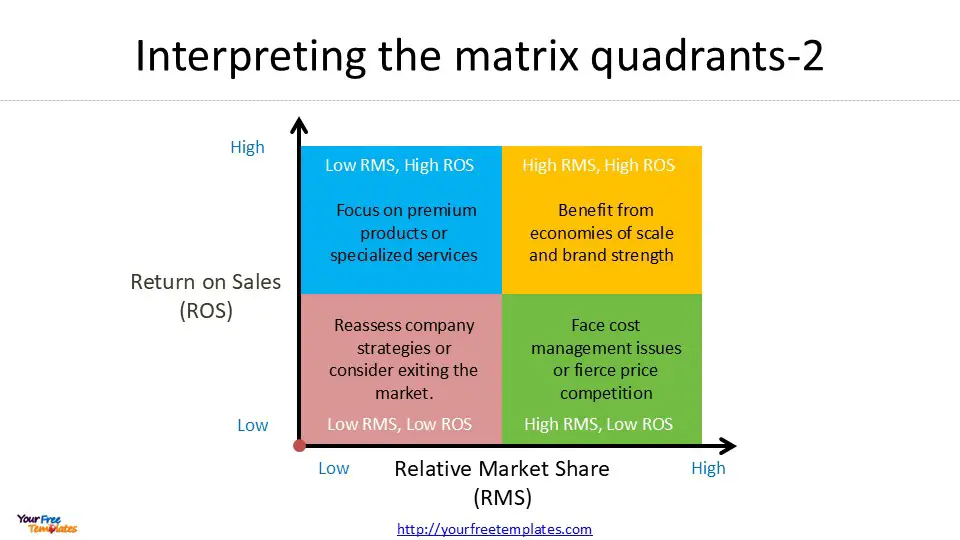
The matrix is typically divided into four quadrants, each providing insights into a company’s market position and profitability:
- High RMS, High ROS: Companies in this quadrant are market leaders with strong profitability. They often benefit from economies of scale and brand strength.
- High RMS, Low ROS: These companies have a significant market share but struggle with profitability. They may face cost management issues or intense price competition.
- Low RMS, High ROS: Niche players in this quadrant have found profitable market segments despite smaller market shares. They often focus on premium products or specialized services.
- Low RMS, Low ROS: Companies here face challenges in both market share and profitability. They may need to reassess their strategies or consider exiting the market.
Significance of bubble sizes in the matrix
The size of each bubble in the ROS/RMS Matrix represents the company’s sales volume or net income. This additional dimension provides crucial context to the RMS and ROS data:
- Market Dominance: Larger bubbles indicate higher sales volumes, showing which companies dominate the market in absolute terms.
- Efficiency Comparison: By comparing bubble sizes with ROS, analysts can identify companies that efficiently convert sales into profits, regardless of market share.
- Growth Potential: Smaller bubbles with high ROS might indicate companies with significant growth potential if they can scale their operations.
- Resource Allocation: The bubble sizes help in understanding how resources are distributed across the market, which can inform competitive strategies.
By analyzing these components together, businesses can gain a comprehensive understanding of their market position and identify opportunities for improvement. The ROS/RMS Matrix serves as a valuable tool for strategic planning, helping companies decide whether to pursue increased market share, focus on profitability, or find a balance between the two.
Conducting an RMS Analysis
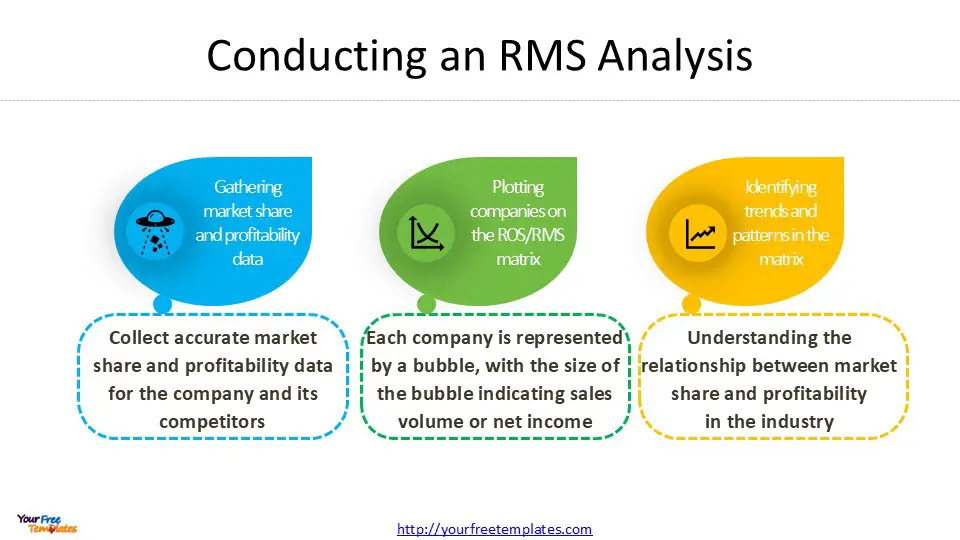
To effectively analyze RMS market share using the ROS/RMS Matrix, businesses need to follow a structured approach. This process involves gathering relevant data, plotting companies on the matrix, and identifying trends and patterns.
Gathering market share and profitability data
The first step in conducting an RMS analysis is to collect accurate market share and profitability data for the company and its competitors. This information is crucial for calculating relative market share and return on sales (ROS). Market share data can be obtained through industry reports, market research, or financial statements. Profitability data, such as operating profit and net sales revenue, is typically found in company financial reports.
To calculate relative market share, companies need to use specific formulas depending on their position in the market. For the market leader, RMS is calculated by dividing their market share by the next biggest competitor’s share. For all other companies, RMS is determined by dividing their market share by the market leader’s share 1.
Plotting companies on the ROS/RMS matrix
Once the necessary data has been gathered, the next step is to plot companies on the ROS/RMS matrix. The x-axis represents relative market share, while the y-axis shows return on sales or another profitability measure. Each company is represented by a bubble, with the size of the bubble indicating sales volume or net income.
To create an effective visual representation, companies should use a logarithmic scale for the x-axis, as this provides a more accurate depiction of relative market positions 2. The y-axis can use a linear scale to represent profitability. It’s important to include all significant competitors in the matrix to gain a comprehensive view of the market landscape.
Identifying trends and patterns in the matrix
After plotting the data, analysts can begin to identify trends and patterns within the matrix. This step is crucial for understanding the relationship between market share and profitability in the industry. Some key observations to look for include:
- Correlation between RMS and profitability: Examine whether there’s a strong positive correlation between relative market share and return on sales. This can indicate the presence of economies of scale in the industry 3.
- Clustering of companies: Look for groups of companies that cluster together in certain quadrants of the matrix. This can reveal different strategic positions within the market.
- Outliers: Identify any companies that deviate significantly from the general trend. These outliers may have unique business models or competitive advantages worth investigating.
- Market leader performance: Assess how the market leader’s position compares to other companies in terms of both market share and profitability.
- Niche player success: Look for smaller companies with low RMS but high profitability, as they may have found successful niche strategies.
By carefully analyzing these trends and patterns, businesses can gain valuable insights into their competitive position and the overall market dynamics. This information can then be used to inform strategic decisions and identify opportunities for growth or improvement in market share and profitability.
Applying RMS Analysis Insights
Developing strategies based on matrix positioning
The ROS/RMS matrix provides valuable insights for companies to develop effective strategies based on their positioning. Companies in the high RMS, high ROS quadrant are market leaders with strong profitability, often benefiting from economies of scale and brand strength. These companies should focus on maintaining their position through continuous innovation and customer retention strategies.
For companies in the high RMS, low ROS quadrant, the priority should be improving operational efficiency and cost management. They may need to reassess their pricing strategies or explore ways to increase perceived value to customers.
Niche players in the low RMS, high ROS quadrant should focus on expanding their market share while maintaining their profitability. This could involve targeted marketing campaigns or exploring new market segments.
Companies in the low RMS, low ROS quadrant face significant challenges and may need to consider repositioning or even exiting the market if improvements cannot be made.
Case studies of successful RMS-based strategies
Several companies have successfully implemented strategies based on RMS analysis. For instance, a study of nine hotels using revenue management software showed an average increase in revenue of 22% and an average ADR (Average Daily Rate) increase of 4% 1. This demonstrates how RMS analysis can drive significant improvements in the hospitality industry.
Another example comes from the consumer electronics industry. Apple, despite having a relatively low relative market share, maintains high profitability by focusing on premium products and brand value. In contrast, Samsung competes effectively with a higher market share and lower prices, while companies like Sony struggle in the middle ground 2.
Limitations and considerations of the ROS/RMS matrix
While the ROS/RMS matrix is a powerful tool, it has limitations that should be considered. One key challenge is ensuring data accuracy. Companies should use reliable market research from reputable industry analysts and multiple data sources to ensure the validity of their analysis 3.
Another consideration is the dynamic nature of markets. Regular updates to the RMS analysis are crucial to account for changes in market dynamics, including economic indicators, technological advances, and regulatory changes.
It’s also important to note that the relationship between market share and profitability isn’t always perfectly correlated. In some industries, companies can succeed at either end of the RMS spectrum, with niche players and market leaders both achieving profitability 2.
Lastly, the ROS/RMS matrix should be used in conjunction with other analytical tools and qualitative factors. While it provides valuable insights into market positioning and profitability, it doesn’t capture all aspects of a company’s performance or potential.
By understanding these limitations and considerations, companies can more effectively leverage RMS analysis to inform their strategic decisions and drive sustainable growth in their respective markets.
Conclusion
The ROS/RMS Matrix has proven to be a valuable tool to analyze market share and profitability. By plotting companies based on their relative market share and return on sales, businesses gain insights into their competitive position and can develop targeted strategies. This approach allows companies to identify their strengths and weaknesses, spot market trends, and make informed decisions about resource allocation and growth opportunities.
While the ROS/RMS Matrix offers significant benefits, it’s crucial to remember its limitations. Regular updates are needed to keep pace with changing market dynamics, and the tool should be used alongside other analytical methods for a comprehensive view. By leveraging RMS analysis effectively, companies can boost their market performance and drive sustainable growth in their industries. In the end, the ROS/RMS Matrix serves as a powerful guide to help businesses navigate the complex landscape of market competition and profitability.
FAQs
1. How is Relative Market Share (RMS) calculated?
Relative Market Share is determined by dividing a company’s market share by the market share of its largest competitor, then multiplying the result by 100. This calculation yields a percentage that indicates the size of a company’s market share relative to its main competitor.
2. What does the ROS/RMS matrix represent?
The ROS/RMS matrix illustrates the relationship between a company’s Return on Sales (ROS) or Return on Assets (ROA) on the vertical axis, and its Relative Market Share (RMS) on the horizontal axis. The size of the bubbles on this chart represents either the sales volume or net income of each company.
3. How can you calculate a company’s market share?
To calculate market share, you should divide your business’s total sales revenue for a specific period by the total revenue of the industry during the same timeframe. Multiply the resulting figure by 100 to convert it into a percentage that represents your market share.
4. What is the meaning of RMS in the context of market share?
RMS stands for Relative Market Share, which is a metric that compares a company’s market share to that of its principal competitors. This measure helps professionals analyze the market share for specific products, services, and the overall sales performance of a company.
Looking for Premium maps, please visit our affiliate site: https://editablemaps.com/ or https://ofomaps.com/
Size:122K
Type: PPTX
RMS market share Template
Click the link to download it.
Aspect Ratio: Standard 4:3
Click the blue button to download it.
Download the 4:3 Template
Aspect Ratio: Widescreen 16:9
Click the green button to download it.
Download the 16:9 Template
References
[1] – https://www.rocketblocks.me/blog/relative-market-share.php
[2] – https://in.indeed.com/career-advice/career-development/relative-market-share
[3] – https://royed.in/what-is-relative-market-share-rms/


