In today’s complex business environment, organizations face numerous challenges that can hinder progress and efficiency. The fishbone diagram, also known as the Ishikawa diagram or cause-and-effect diagram, has become an invaluable tool to identify and analyze problems. This visual representation helps teams pinpoint root causes and develop effective solutions, making it a cornerstone of quality management and process improvement initiatives.
At the end of this post, you can download our Fishbone Diagram PowerPoint template to fit your purpose. As the same diagram PowerPoint template series, you can also find our Pareto Chart, Occam’s Razor, Data Mining, marketing segment, Porter’s five forces, SWOT Analysis, GE Matrix, BCG Matrix, Artificial Intelligence, National Diamond and BlockChain PowerPoint templates.
This guide will walk readers through the process of creating and using a fishbone diagram. It will cover the anatomy of the diagram, provide a step-by-step approach to its construction, and explain how to enhance the analysis with the 5 Whys technique. Additionally, the article will address common pitfalls and offer tips to avoid them. By mastering this powerful tool, professionals can gain deeper insights into complex issues and drive meaningful improvements in their organizations.
The Anatomy of a Fishbone Diagram
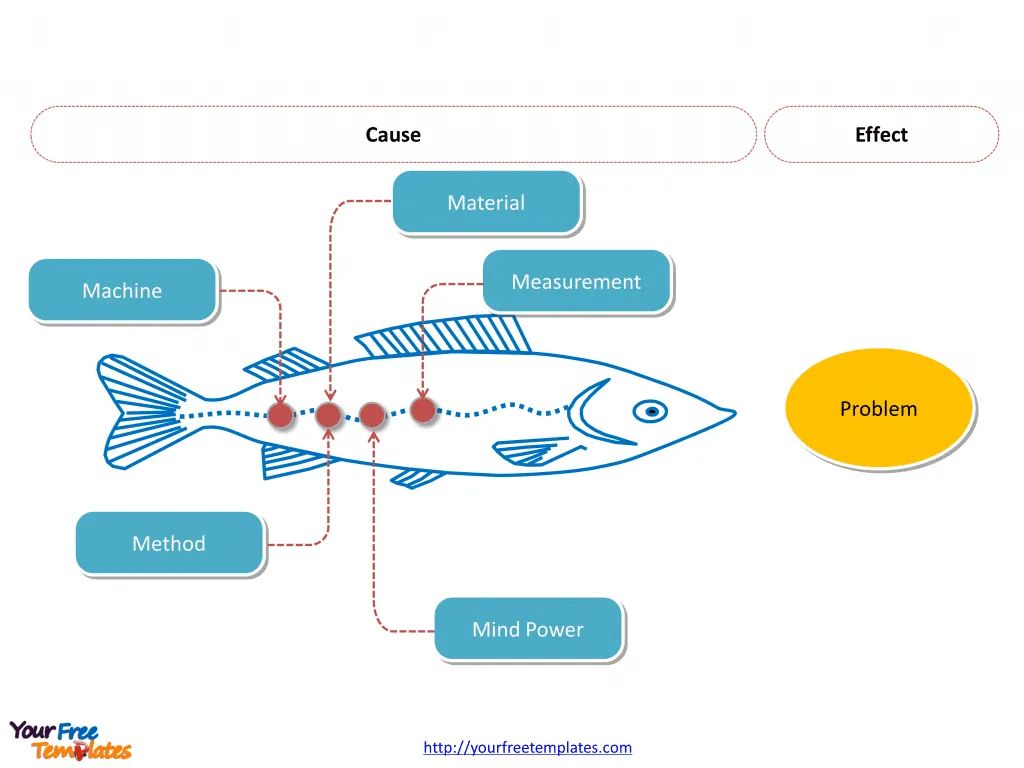
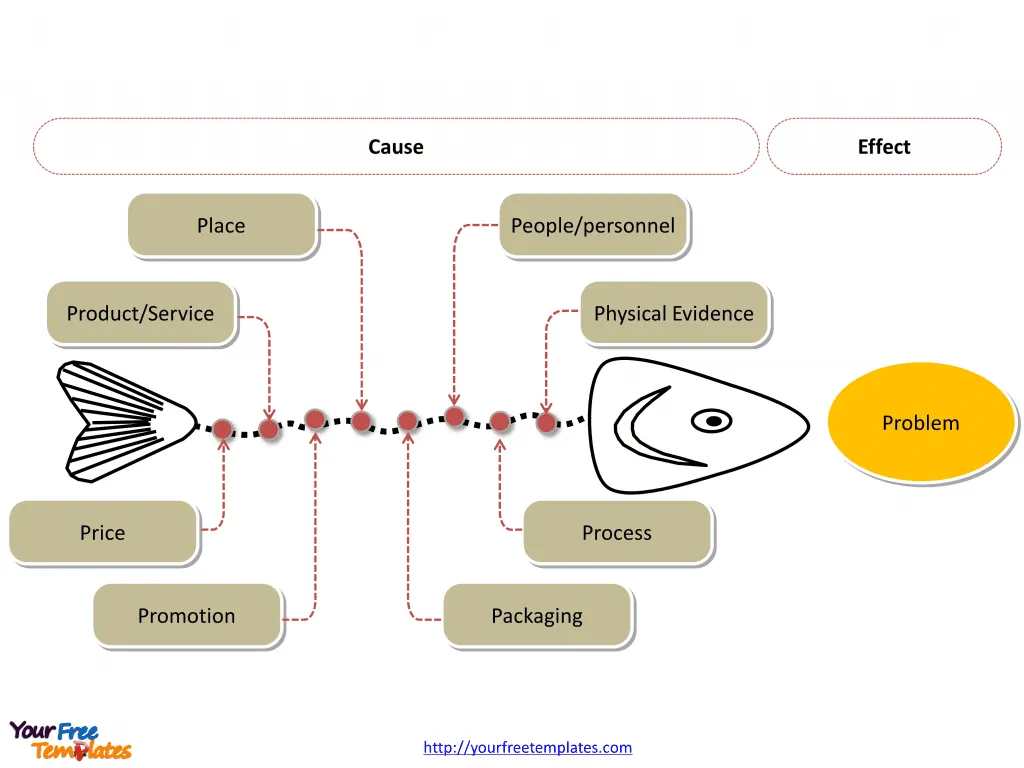
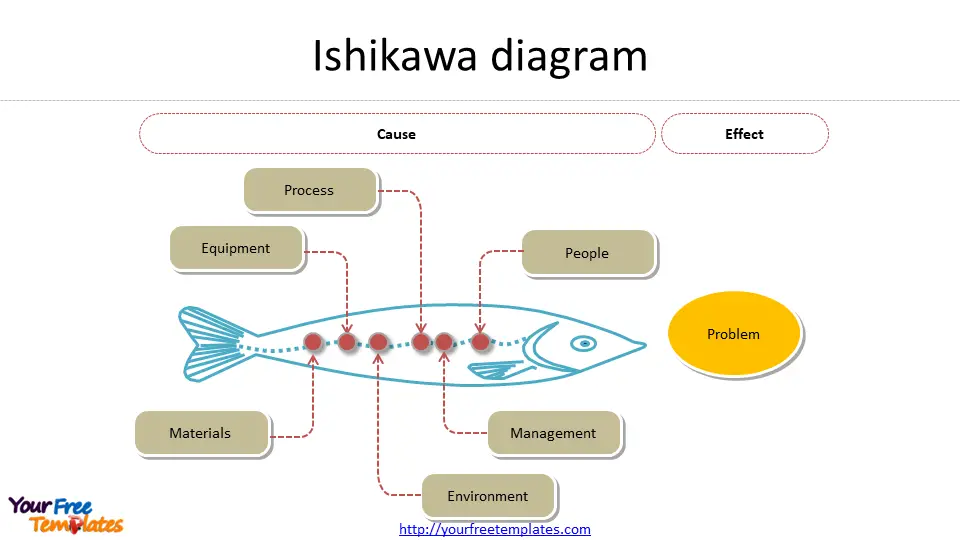
The fishbone diagram, also known as the Ishikawa diagram or cause-and-effect diagram, is a powerful visual tool used to identify and analyze the root causes of problems in various processes 1. Its structure resembles a fish skeleton, which gives it its distinctive name. This diagram helps teams break down complex issues into manageable components, making it easier to understand and address the underlying causes of a problem.
The Fish Head: Problem Statement
At the right side of the diagram, the “fish head” represents the main problem or effect being analyzed 2. This is where the team clearly defines and writes down the exact issue they’re facing. It’s crucial to have a well-defined problem statement that includes who’s involved, what the problem is, and when and where it occurs 2. This problem statement is typically enclosed in a box, serving as the starting point for the analysis.

The Spine and Bones: Causes and Sub-causes
Extending to the left from the fish head is the “spine” of the diagram, which forms the backbone of the analysis 2. Branching off from this central line are the “bones” of the fish, representing the major categories of potential causes. These categories help organize the brainstorming process and ensure a comprehensive analysis of the problem.
In manufacturing settings, these categories often revolve around the “6 Ms” described by Ishikawa 3:
- Man (People)
- Machine (Equipment)
- Method (Process)
- Material
- Measurement
- Mother Nature (Environment)
However, the categories can be customized based on the specific context of the problem being analyzed. For instance, in service industries, categories might include policies, procedures, people, and plant (environment) .
From each of these main bones, smaller bones branch out to represent specific causes and sub-causes related to each category 2. This hierarchical structure allows teams to drill down into the details of each potential cause, creating a comprehensive map of the problem’s root causes.
To populate these bones with potential causes, teams engage in a structured brainstorming session. They ask questions like “Why does this happen?” for each category and sub-category, encouraging deeper levels of analysis 4. This process of continually asking “Why?” is similar to the 5 Whys technique, which can be used in tandem with the fishbone diagram to uncover the deepest root causes .
The fishbone diagram’s structure promotes thorough thinking about the causes of the problem. It pushes teams to consider nearly every possible cause instead of getting stuck on the most obvious ones . This comprehensive approach helps ensure that no potential cause is overlooked, increasing the likelihood of identifying the true root cause of the problem.
By visually mapping out the causes and sub-causes, the fishbone diagram provides a clear and organized representation of the problem’s complexity. This visual format makes it easier for teams to identify patterns, relationships between different causes, and areas that require further investigation or data collection.
Step-by-Step Process of Creating a Fishbone Diagram
Creating a fishbone diagram is a systematic process that helps teams identify and analyze the root causes of a problem. This visual tool, also known as the Ishikawa diagram or cause-and-effect diagram, resembles a fish skeleton and provides a structured approach to problem-solving 1. To create an effective fishbone diagram, teams should follow these steps:
Defining the Problem
The first and most crucial step in creating a fishbone diagram is to clearly define the problem. This problem statement forms the “head” of the fish and serves as the focal point for the entire analysis 1. When defining the problem, it’s essential to:
- Be as clear and specific as possible about the issue at hand.
- Include relevant details such as where and when the problem occurred, who was involved, and its impact on the business.
- Avoid defining the problem in terms of a solution (e.g., “we need more of something”) 3.
For example, instead of stating, “The contact center abandon rate is too high,” a more effective problem statement would be, “The contact center abandon rate increased by 20% last month” 4. This specific and measurable statement provides a clear objective for the team to work towards.
Identifying Major Categories
Once the problem is defined, the next step is to identify the major categories of potential causes. These categories form the main “bones” branching off from the central spine of the fish 1. In manufacturing settings, the “6 Ms” described by Ishikawa are often used as a starting point 2:
- Man (People)
- Machine (Equipment)
- Method (Process)
- Material
- Measurement
- Mother Nature (Environment)
However, teams can customize these categories based on the specific context of their problem. For example, in service industries, categories might include equipment, materials, systems, external forces, and people 4. The key is to choose categories that make sense for the project and cover all potential areas of influence.

Listing Potential Causes
With the major categories in place, the team can begin brainstorming potential causes for each category. This step involves:
- Drawing shorter lines off the main “bones” to represent specific causes related to each category 2.
- Asking “Why does this happen?” for each category and listing all possible causes 3.
- Encouraging input from all team members to ensure a comprehensive analysis 1.
- Using the “5 Whys” technique to delve deeper into each cause and uncover root causes 4.
As the team generates ideas, they should write each potential cause as a branch off its corresponding category. For more complex causes, sub-branches can be added to provide further detail 2. This visual representation helps organize thoughts and ensures that no potential cause is overlooked.
Throughout this process, it’s important to promote systematic brainstorming and collaboration among team members. The fishbone diagram’s structure facilitates a holistic view of the problem, encouraging comprehensive analysis and helping to identify patterns, trends, and relationships among different factors 3.
By following these steps, teams can create a comprehensive fishbone diagram that serves as a powerful tool for problem analysis and root cause identification. This structured approach ensures that organizations address the actual causes of problems rather than implementing superficial solutions 4.
Enhancing Your Fishbone Diagram with the 5 Whys Technique
The 5 Whys technique is a powerful tool that can significantly enhance the effectiveness of a fishbone diagram. By combining these two methods, teams can drill down to the root causes of problems and develop more targeted solutions.
Understanding the 5 Whys
The 5 Whys technique, developed by Sakichi Toyoda, is a simple yet effective method for uncovering the cause-and-effect relationships underlying a problem 1. This approach involves asking “Why?” repeatedly to peel away the layers of symptoms and get to the root cause of an issue.
The process is straightforward:
- Start with the problem statement.
- Ask “Why?” to identify the cause of the problem.
- For each answer, ask “Why?” again to dig deeper.
- Repeat this process typically five times, or until the root cause is identified 1.
It’s important to note that while it’s called the “5 Whys,” the number of iterations may vary depending on the complexity of the problem. The goal is to continue asking “Why?” until the team reaches a cause that, if addressed, would prevent the problem from recurring 2.
Integrating 5 Whys into Your Fishbone Analysis
Combining the 5 Whys technique with the fishbone diagram creates a powerful synergy for problem-solving. Here’s how to integrate these two methods:
- Create the fishbone diagram: Start by defining the problem and identifying the major categories of potential causes 1.
- Brainstorm causes: For each category, list potential causes as branches off the main “bones” of the diagram 1.
- Apply the 5 Whys: For the most significant causes identified in the fishbone diagram, apply the 5 Whys technique 4.
- Add sub-branches: As you ask “Why?” for each cause, add the answers as sub-branches to the existing causes on the fishbone diagram 4.
- Identify root causes: Continue this process until you reach the root causes for each major branch of the fishbone diagram 4.
By integrating the 5 Whys into the fishbone analysis, teams can:
- Develop a more detailed understanding of the problem 2
- Uncover deeper levels of causes that might not be immediately apparent 1
- Identify solutions that address root causes rather than just symptoms 2
- Create a more comprehensive visual representation of the problem and its causes 4
This combined approach helps teams move beyond surface-level analysis and develop more effective, long-lasting solutions to complex problems. It encourages systematic thinking and collaboration, ensuring that all potential factors contributing to the issue are thoroughly explored and understood 1 4.

Common Pitfalls and How to Avoid Them
While the fishbone diagram is a powerful tool for identifying and analyzing root causes of problems, its effectiveness can be compromised by certain common pitfalls. By being aware of these challenges and taking steps to avoid them, teams can enhance the quality of their analysis and achieve better results.
Overlooking Root Causes
One of the primary pitfalls in using a fishbone diagram is the tendency to overlook root causes. This often happens when teams focus too heavily on surface-level symptoms rather than digging deeper into the underlying factors 1. To avoid this pitfall, it’s crucial to:
- Use the 5 Whys technique in conjunction with the fishbone diagram. This method involves asking “Why?” repeatedly to peel away the layers of symptoms and get to the root cause of an issue 4.
- Encourage team members to think beyond the obvious causes and consider all potential factors contributing to the problem 1.
- Develop a detailed understanding of the problem by exploring each branch of the fishbone diagram thoroughly 4.
By addressing this pitfall, teams can ensure that they’re not just implementing superficial solutions but tackling the true underlying causes of the problem.
Failing to Prioritize Causes
Another common pitfall is the failure to prioritize the identified causes effectively 2. When teams generate a large number of potential causes, it can be challenging to determine which ones are most critical to address. To overcome this challenge:
- Use data and evidence to support the identified causes rather than relying solely on opinions 4.
- Implement a structured approach to evaluate the impact and likelihood of each cause 2.
- Focus on addressing the most significant root causes that, if resolved, would prevent the problem from recurring 4.
By prioritizing causes effectively, teams can allocate their resources more efficiently and develop targeted solutions that have the greatest impact on resolving the problem.
To further enhance the effectiveness of the fishbone diagram analysis, teams should also be mindful of the following:
- Avoid creating overly complex diagrams that can lead to confusion. Keep the diagram clear and focused on the most relevant causes 1.
- Ensure that the team has a diverse range of perspectives and expertise to provide a comprehensive analysis of the problem 1.
- Use the fishbone diagram as a starting point for further investigation and testing, rather than accepting all identified causes as definitive 4.
- Regularly review and update the fishbone diagram as new information becomes available or as the problem evolves 4.
By being aware of these common pitfalls and taking proactive steps to avoid them, teams can maximize the benefits of using the fishbone diagram. This approach helps ensure that the root cause analysis is thorough, accurate, and leads to effective solutions for complex problems in various organizational settings.
Conclusion
The fishbone diagram, combined with the 5 Whys technique, offers a powerful approach to analyze complex problems and uncover their root causes. This visual tool has a significant impact on team collaboration, encouraging systematic thinking and comprehensive exploration of all potential factors contributing to an issue. By using this method, organizations can move beyond surface-level fixes and develop more effective, long-lasting solutions.
To make the most of the fishbone diagram, teams should be aware of common pitfalls like overlooking root causes or failing to prioritize identified issues. By avoiding these traps and following a structured approach, professionals can gain deeper insights into organizational challenges. This leads to more targeted problem-solving efforts, ultimately boosting productivity and driving meaningful improvements across various business processes.
Looking for Premium maps, please visit our affiliate site: https://ofomaps.com/
Size:116K
Type: PPTX
Aspect Ratio: Standard 4:3
Click the blue button to download it.
Download the 4:3 Template
Aspect Ratio: Widescreen 16:9
Click the green button to download it.
Download the 16:9 Template
References
[1] – https://www.cms.gov/medicare/provider-enrollment-and-certification/qapi/downloads/fishbonerevised.pdf
[2] – https://asq.org/quality-resources/fishbone
[3] – https://txm.com/fishbone-diagrams/
[4] – https://www.kainexus.com/improvement-disciplines/fishbone-diagram


