In today’s fast-paced business world, strategic planning is crucial for companies to stay competitive and thrive. The GE Matrix, also known as the McKinsey GE Matrix, is a powerful tool that helps organizations assess their portfolio performance and make informed decisions about resource allocation. This matrix provides a comprehensive framework to evaluate business units or product lines based on industry attractiveness and competitive strength, offering valuable insights for strategic decision-making.
At the end of this post, you can download our GE Matrix PowerPoint template to fit your purpose. As the same diagram PowerPoint template series, you can also find our Data Mining, marketing segment, Porter’s five forces, SWOT Analysis, BCG Matrix, Artificial Intelligence, National Diamond and BlockChain PowerPoint templates.
The GE Matrix goes beyond traditional methods like the BCG Matrix or SWOT analysis, providing a more nuanced approach to strategic planning. It allows companies to visualize their portfolio’s position in the market and identify areas for growth or divestment. This guide will walk you through the key components of the GE Matrix, explain how to use it effectively, and discuss its strategic implications. By the end, you’ll have a solid understanding of how to apply this tool to improve your organization’s competitive position and drive long-term success.
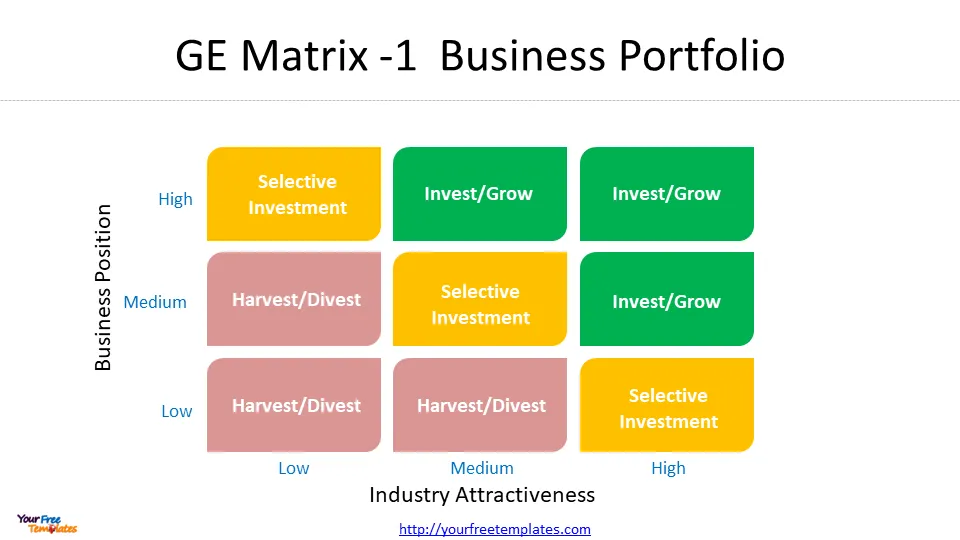
Understanding the GE Matrix
The GE Matrix, also known as the McKinsey GE Matrix or the GE-McKinsey nine-box matrix, is a sophisticated strategic planning tool that helps organizations evaluate their business portfolio and make informed investment decisions 1 . This framework goes beyond simple product analysis, allowing companies to assess entire business units, product lines, or services based on two key dimensions: industry attractiveness and competitive strength .
Components of the GE Matrix
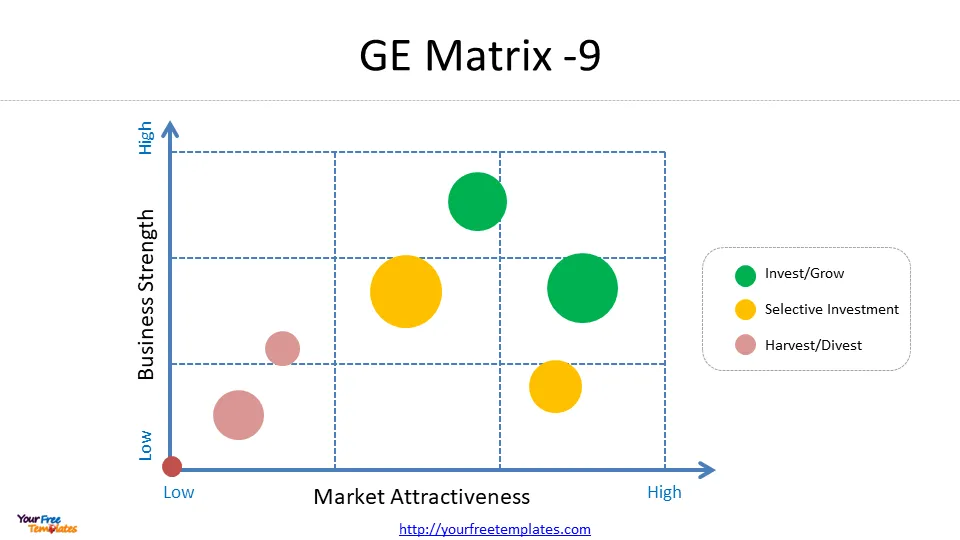
The GE Matrix is structured as a 3×3 grid, with industry attractiveness on the vertical axis and competitive strength of the business unit on the horizontal axis . Each axis is divided into three levels: high, medium, and low. This creates nine distinct cells, each representing a different strategic position.
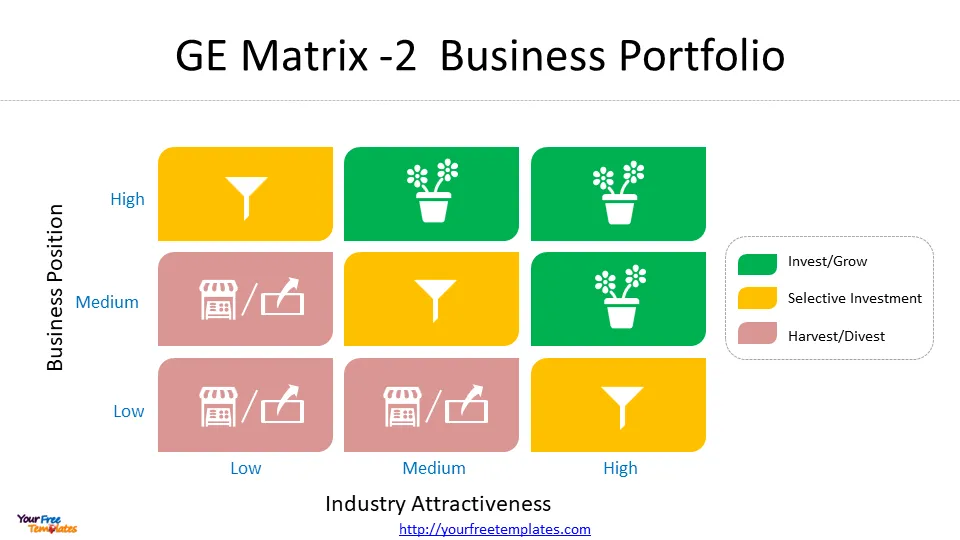
The matrix helps managers categorize their business units or products into three main strategic areas:
- Grow/Invest: Units in the upper-left corner of the matrix, representing high industry attractiveness and high competitive strength. These units warrant increased investment and resources .
- Hold/Selectivity: Units in the diagonal from the lower-left to the upper-right corner, representing average performance in average markets. These require careful consideration before additional investment 4.
- Harvest/Divest: Units in the lower-right corner, indicating low industry attractiveness and low competitive strength. These may be candidates for divestment or limited investment .
Industry Attractiveness Factors
Industry attractiveness is a measure of how favorable an industry is for long-term profitability and growth. It considers various external factors that influence the potential success of a business unit within a given market . Some key factors to consider when evaluating industry attractiveness include:
- Market size and growth rate
- Industry profitability
- Entry and exit barriers
- Supplier and buyer power
- Threat of substitutes and available complements
- Industry structure
- Product life cycle changes
- Demand trends
- Pricing trends
- Macro-environmental factors (PESTEL analysis)
- Seasonality
- Labor availability
- Market segmentation
It’s important to note that industry attractiveness should be assessed with a long-term perspective, as investments in business units often require long-lasting commitments.
Business Unit Strength Factors
Business unit strength, also referred to as competitive strength, measures how well a particular business unit performs against its rivals in the market . This dimension focuses on internal factors that contribute to a unit’s competitive advantage. Key factors to consider when evaluating business unit strength include:
- Total market share
- Market share growth compared to rivals
- Brand strength and value
- Profitability
- Customer loyalty
- VRIO resources or capabilities
- Strength in meeting industry’s critical success factors
- Value chain strength
- Level of product differentiation
- Production flexibility 4
To assess these factors effectively, managers can employ various analytical tools such as the VRIO framework, Competitive Profile Matrix, and Value Chain Analysis 5.
By systematically evaluating both industry attractiveness and business unit strength, the GE Matrix provides a comprehensive view of a company’s portfolio. This allows managers to prioritize investments, allocate resources effectively, and make strategic decisions about growth, maintenance, or divestment of various business units .
The GE Matrix offers several advantages over simpler models like the BCG Matrix. It provides a more nuanced approach to portfolio analysis, considering a broader range of factors and allowing for a more accurate representation of complex business environments . This comprehensive framework enables managers to develop more sophisticated and appropriate solutions, ultimately leading to higher quality decision-making and improved customer satisfaction 6.
Step-by-Step Guide to Using the GE Matrix
The GE Matrix, also known as the GE/McKinsey Matrix, is a powerful strategic tool that helps multi-business corporations manage their portfolios and prioritize investments across products and Strategic Business Units (SBUs) 1. To effectively utilize this framework, organizations need to follow a systematic approach. This guide outlines the key steps to implement the GE Matrix for strategic decision-making.
Determining Industry Attractiveness
The first step in using the GE Matrix is to assess the industry attractiveness for each SBU. This evaluation forms the vertical axis (Y-axis) of the matrix and is crucial for understanding the potential for long-term success in a given market .
To determine industry attractiveness, companies should consider the following factors:
- Market size and growth rate
- Industry profitability
- Market growth potential
- Industry segmentation
- Level of competition
- Technological advancements
- Regulatory environment
Organizations can use tools such as Porter’s Five Forces or PESTLE analysis to gather comprehensive insights into these factors. It’s important to note that this assessment is subjective and should be based on a thorough understanding of the business unit’s industry or sector .
Assessing Business Unit Strength
The next step involves evaluating the competitive strength of each strategic business unit, which forms the horizontal axis (X-axis) of the GE Matrix. This assessment helps determine how well a particular business unit performs against its rivals in the market .
Key factors to consider when assessing business unit strength include:
- Market share and growth compared to competitors
- Brand equity and reputation
- Customer loyalty
- Sustainable competitive advantages (using VRIO analysis)
- Internal competencies
- Strength of the value chain
- Production capacity
- Product lines
- Pricing and cash flows
- Profit margins compared to competitors 4
To conduct a comprehensive evaluation, companies can employ various analytical tools such as VRIO analysis, Competitive Profile Matrix, and Value Chain Analysis .
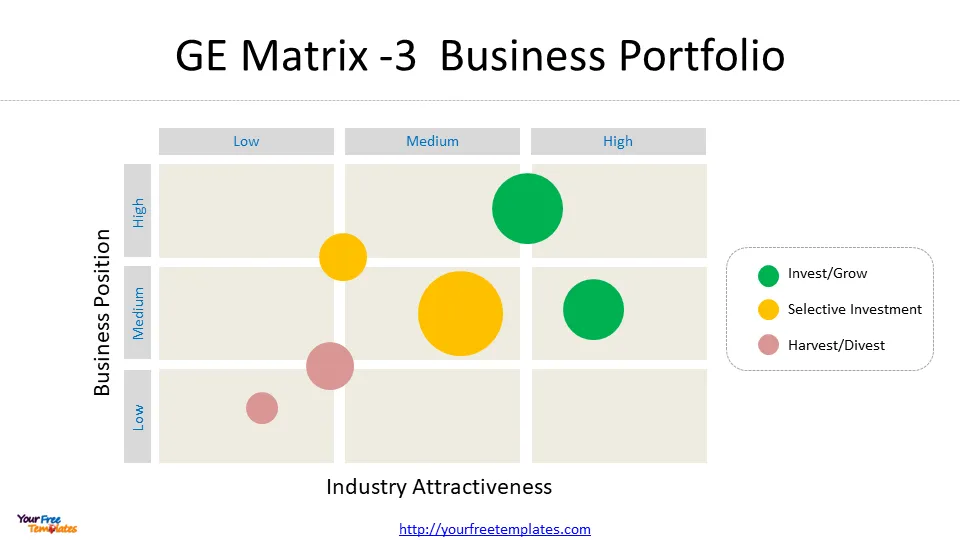
Plotting on the Matrix
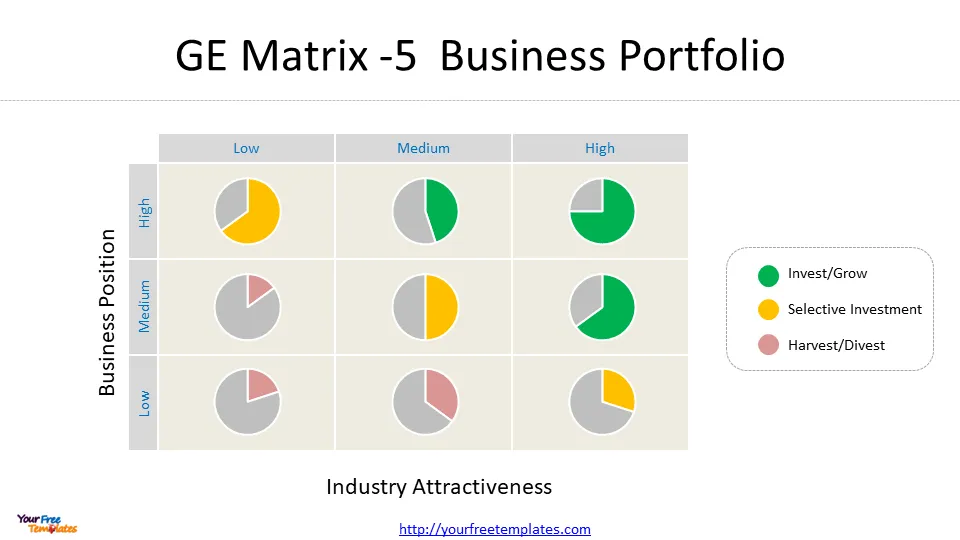
Once the assessments for industry attractiveness and business unit strength are complete, the next step is to plot each SBU on the GE Matrix. The matrix is structured as a 3×3 grid, with industry attractiveness on the vertical axis and competitive strength on the horizontal axis .
To plot the SBUs:
- Use the market attractiveness score to determine the Y-axis position
- Use the business strength score to determine the X-axis position
- Place each business unit in the appropriate cell based on these assessments
The resulting positions on the 3×3 chart will indicate whether the company should grow, hold, or harvest specific business units .
Interpreting Results
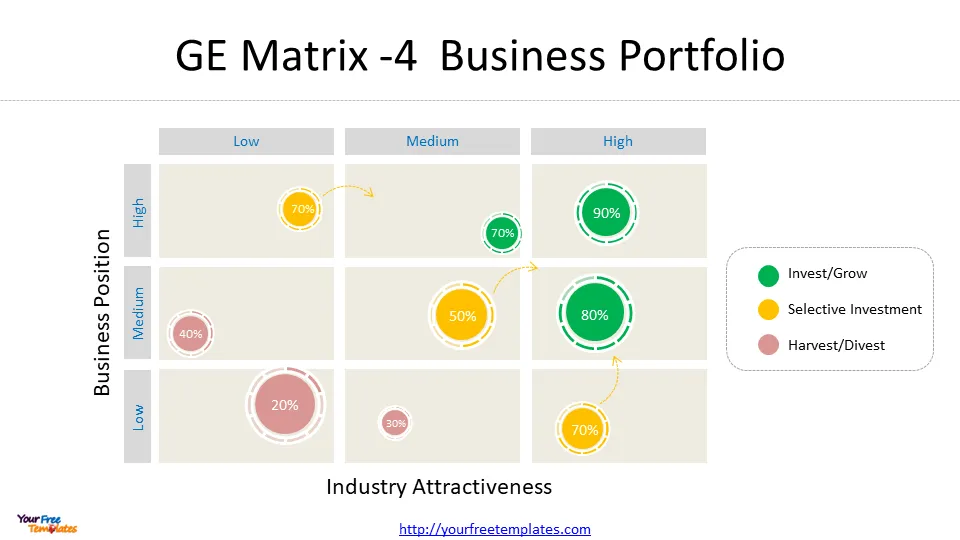
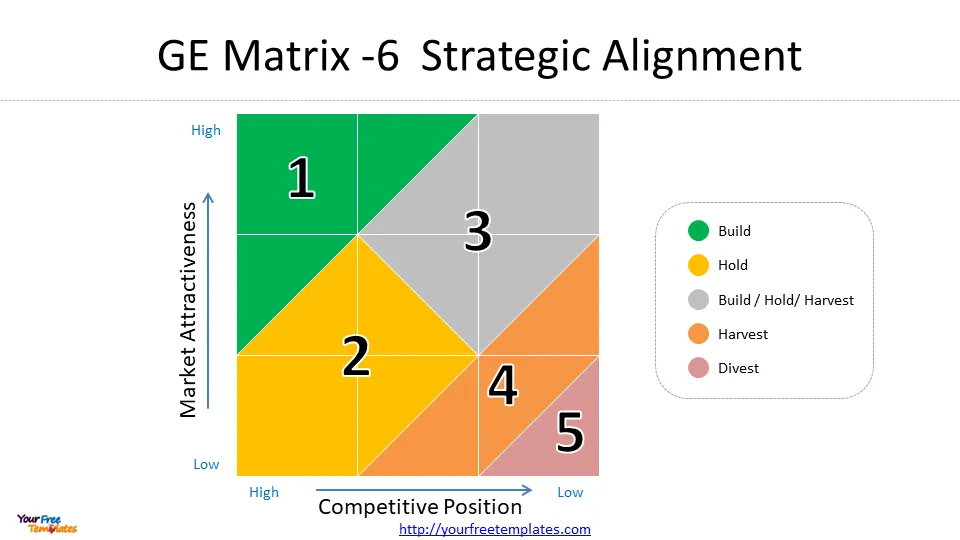
The final step in using the GE Matrix is to interpret the results and make strategic decisions based on the positions of the SBUs. The matrix typically divides the grid into three main strategic areas:
- Grow/Invest: Units in the upper-left corner, representing high industry attractiveness and high competitive strength. These warrant increased investment and resources.
- Hold/Selectivity: Units in the diagonal from lower-left to upper-right, representing average performance in average markets. These require careful consideration before additional investment.
- Harvest/Divest: Units in the lower-right corner, indicating low industry attractiveness and low competitive strength. These may be candidates for divestment or limited investment .
When interpreting the results, it’s crucial to consider additional factors beyond the matrix itself. Companies should analyze business units in more detail to understand all strategic implications, using tools such as SWOT analysis, Porter’s 5 Forces, or PESTEL analysis to identify potential risks and opportunities 4.
Key questions to address during this phase include:
- How much capital should be allocated to each business unit?
- Does investing in these SBUs align with the company’s long-term strategy?
- Which specific aspects of a particular business unit should receive investment?
As Michael Porter, the father of modern business strategy, states, “The essence of strategy is choosing what not to do” 5. This step helps organizations focus their resources on the most promising areas and avoid wasting efforts on misaligned initiatives.
By following this step-by-step guide, companies can effectively utilize the GE Matrix to gain valuable insights into their portfolio performance and make informed strategic decisions. This comprehensive approach allows for a nuanced evaluation of business units, enabling organizations to prioritize investments, allocate resources effectively, and drive long-term success in a competitive business landscape.
Strategic Implications and Decision Making
The GE Matrix serves as a powerful tool for strategic decision-making, enabling companies to manage their portfolio of activities effectively and allocate resources efficiently 1. By positioning Strategic Business Units (SBUs) on the matrix, organizations can develop appropriate strategic directions and prioritize investments to achieve optimal returns .
Invest/Grow Strategies
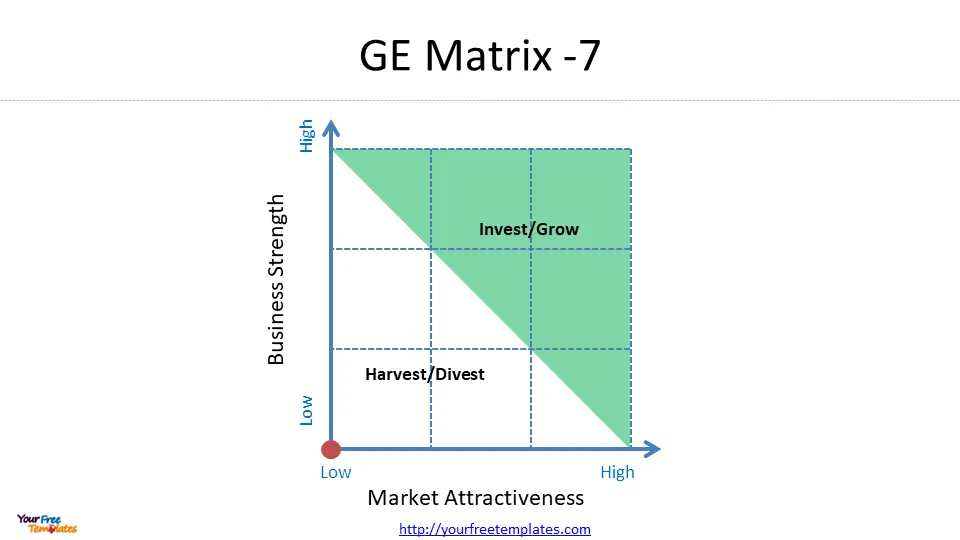
For SBUs falling in the upper-left corner of the matrix, representing high industry attractiveness and high competitive strength, the recommended strategy is to invest and grow . These business units promise the highest returns in the future and warrant significant resource allocation .
Key considerations for invest/grow strategies include:
- Allocating substantial financial resources to these SBUs
- Investing in research and development
- Increasing advertising efforts
- Pursuing strategic acquisitions
- Expanding production capacity to meet future demand
Companies should provide ample resources to these business units to ensure there are no constraints on their growth potential . This approach aligns with the matrix’s aim of strengthening and growing promising SBUs for long-term success 4.
Hold/Maintain Strategies
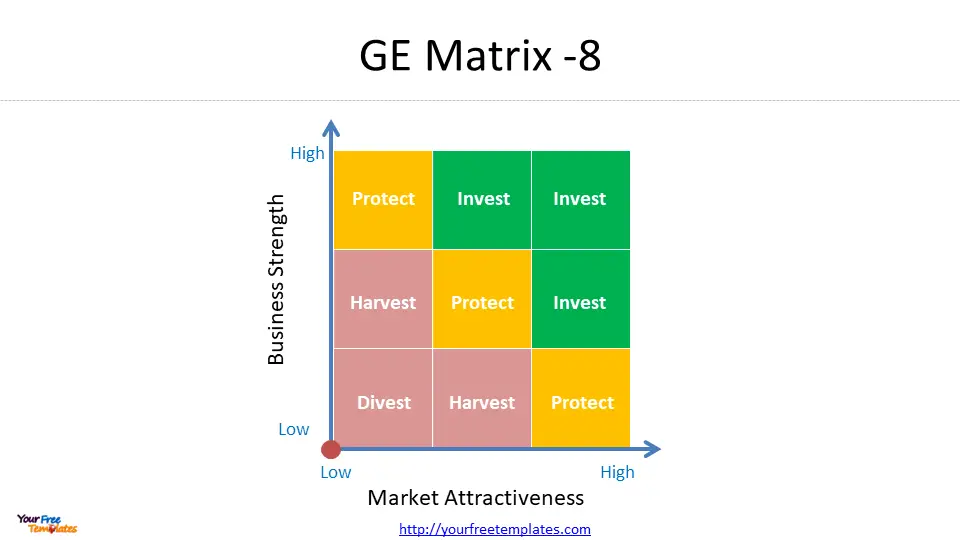
SBUs positioned in the diagonal from the lower-left to the upper-right corner of the matrix represent average performance in average markets 4. These business units require a more selective approach to investment and resource allocation .
For hold/maintain strategies, companies should consider:
- Investing only if there’s surplus capital after funding invest/grow SBUs
- Focusing on business units operating in large markets with few dominant players
- Aiming to improve the SBU’s competitive position through targeted investments
- Monitoring performance closely to identify opportunities for improvement
These strategies often involve careful consideration and analysis of the SBU’s potential for future cash generation and market growth . The goal is to maintain the business unit’s position while exploring opportunities to enhance its performance and market share.
Harvest/Divest Strategies
SBUs located in the lower-right corner of the matrix, indicating low industry attractiveness and low competitive strength, may be candidates for harvesting or divestment 4. These business units typically operate in unattractive industries, lack sustainable competitive advantages, or demonstrate poor performance relative to competitors 4.
When implementing harvest/divest strategies, companies should:
- Treat cash-generating SBUs similarly to “cash cows” in the BCG matrix
- Invest minimally to keep the business unit operational while collecting generated cash
- Ensure investments do not exceed cash generated by the SBU
- Consider divesting or liquidating business units that consistently generate losses 6
The primary objective of these strategies is to maximize short-term cash flow while minimizing long-term commitments to underperforming business units 5.
To illustrate the application of these strategies, consider the following examples:
- Microsoft Internet Explorer: Once a dominant browser, it faced increased competition and industry changes. Microsoft likely decided to implement a harvest strategy, eventually phasing out the product 5 .
- David Jones: After underperforming post-acquisition, Woolworths Holding Ltd. likely adopted a selective hold/maintain approach in response to changing market conditions 6 1.
- Netflix: As technology and consumer preferences shifted towards streaming, Netflix’s video-on-demand service moved to an aggressive growth strategy, warranting significant investment .
The GE Matrix provides a simplified approach to portfolio analysis and investment allocation decisions, offering a highly replicable and consistent framework applicable across various industries 2. However, it’s important to note that the matrix represents a snapshot of portfolio performance and relies on subjective estimations of market attractiveness and business strength 6.
By leveraging the insights gained from the GE Matrix, companies can make informed decisions about resource allocation, identify promising activities for the future, and address potential threats to sustainability . This comprehensive approach to strategic planning enables organizations to optimize their portfolio performance and drive long-term success in a competitive business landscape.
Conclusion
The GE Matrix proves to be a game-changer in strategic planning, offering a nuanced approach to assess and manage business portfolios. By evaluating industry attractiveness and business unit strength, this tool provides valuable insights to make informed decisions about resource allocation and investment strategies. Its comprehensive framework allows companies to visualize their portfolio’s position in the market, helping them identify areas for growth or divestment.
In the end, the GE Matrix equips organizations with a powerful means to optimize their competitive position and drive long-term success. By applying this tool, businesses can make smarter choices about where to invest their resources and how to shape their future strategies. The matrix’s flexibility and depth make it a go-to resource for companies looking to stay ahead in today’s fast-paced business world.
FAQs
What is the GE Matrix used for in strategic planning? The GE Matrix, also known as the GE / McKinsey matrix, is a strategic tool used to evaluate the strength of different strategic business units (SBUs) within a corporation. It assesses market attractiveness and competitive strength to determine the overall positioning of an SBU on a 3×3 grid.
How does the GE Matrix assist in strategic management? The GE McKinsey Matrix serves as a strategic framework that aids multi-business corporations in managing their portfolios and prioritizing investments across various products and strategic business units (SBUs). It evaluates two main factors: the competitive strength of an SBU and the market attractiveness of the industry it operates in.
What is the purpose of a matrix approach in strategic planning? A matrix approach, such as the strategy prioritization matrix, is a crucial tool for making strategic decisions. It helps businesses prioritize initiatives by evaluating and ranking them based on specific criteria, which enables effective resource allocation and supports long-term success.
What strategic decisions are facilitated by the GE 9-cell matrix? The GE 9-Cell Matrix is a strategic tool used to manage a diversified product portfolio. It is a nine-cell (3×3) grid that helps classify business units based on two essential dimensions: industry attractiveness and business unit strength, guiding strategic decisions such as investment and resource allocation.
For other interesting maps, pls visit our ofomaps.com
Size:231K
Type: PPTX
[sociallocker]Aspect Ratio: Standard 4:3
Click the blue button to download it.
Download the 4:3 Template
Aspect Ratio: Widescreen 16:9
Click the green button to download it.
Download the 16:9 Template[/sociallocker]
References
[1] – https://www.professionalacademy.com/blogs/marketing-theories-ge-matrix/
[2] – https://www.cascade.app/blog/ge-matrix
[3] – https://lucidspark.com/blog/ge-mckinsey-matrix
[4] – https://www.sydle.com/blog/ge-mckinsey-matrix-6312316eec394d59be6bc535
[5] – https://strategicmanagementinsight.com/tools/ge-mckinsey-matrix/
[6] – https://getlucidity.com/strategy-resources/guide-to-the-ge-matrix/


