

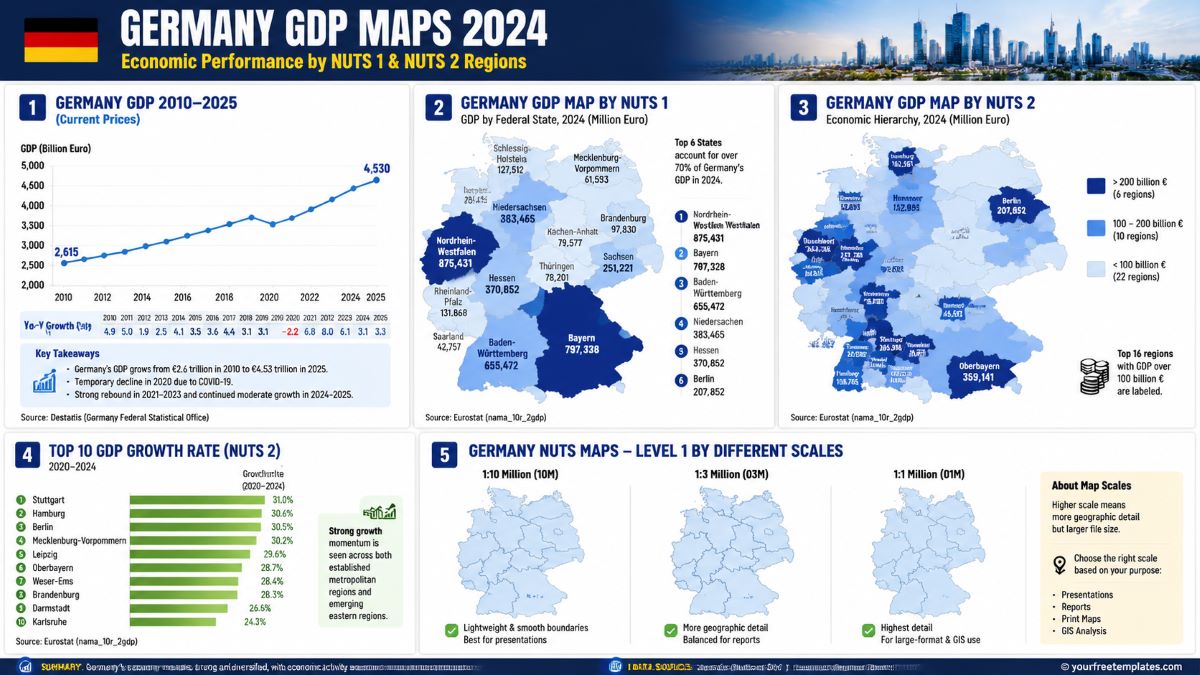
Germany is Europe’s largest economy and one of the world’s leading industrial nations. However, economic activity is not evenly distributed across the country. From automotive manufacturing in Bavaria and Baden-Württemberg to finance, chemicals, logistics, and technology hubs in western and northern Germany, regional differences play an important role in understanding Germany’s economic landscape.
This Germany GDP Map collection provides editable PowerPoint templates to visualize Germany’s economic performance from national GDP trends to detailed NUTS 1 and NUTS 2 regional comparisons.
The templates include:
- Germany GDP Trend (2010–2025)
- Germany GDP Map by 16 Federal States (NUTS 1)
- Germany GDP Map by 38 Regional Areas (NUTS 2)
- Top GDP Regions Ranking
- Fastest Growing GDP Regions (2020–2024)
- Germany NUTS Map Scale Comparison
All maps are designed for business presentations, economic analysis, consulting reports, education, and regional research.
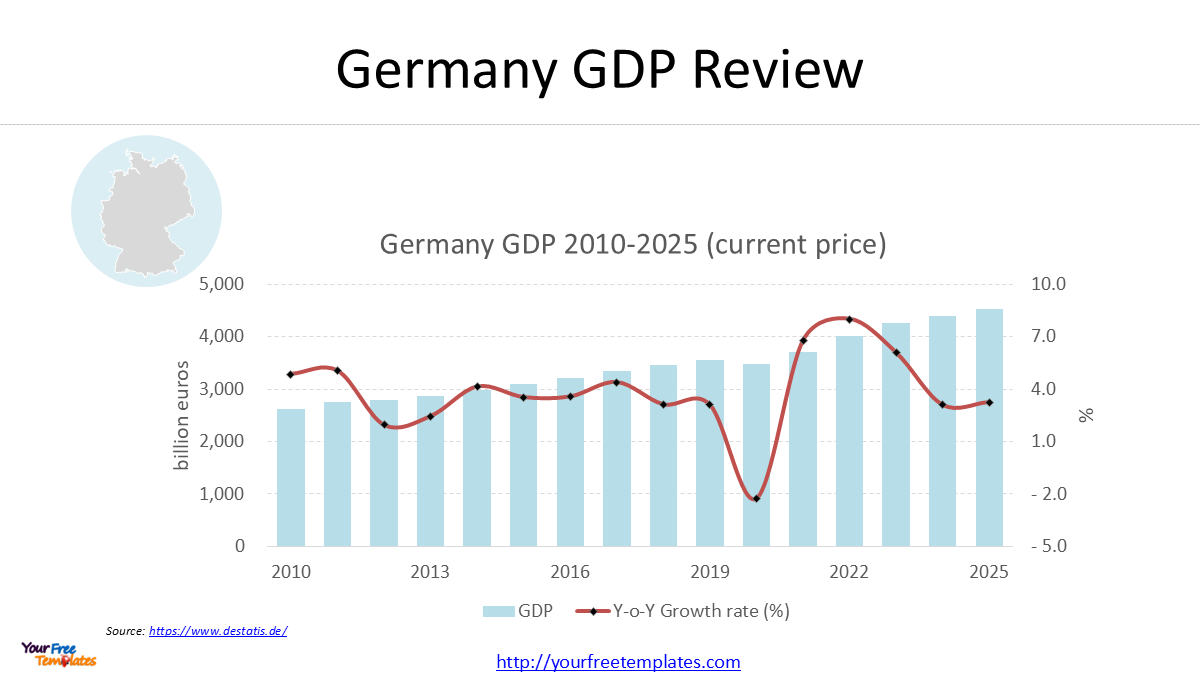
Germany GDP Growth Trend (2010–2025)
Germany’s economy has continued expanding over the past 15 years despite several major disruptions, including the European debt crisis, COVID-19 pandemic, energy price shocks, and global supply chain challenges.
According to current-price GDP data, Germany’s GDP increased from approximately €2.6 trillion in 2010 to more than €4.5 trillion in 2025.
The overall trend shows:
- Strong expansion during 2010–2019
- Temporary decline in 2020 due to the COVID-19 pandemic
- Strong rebound during 2021–2023
- Continued moderate growth in 2024–2025
Although Germany’s economic growth has slowed compared with previous decades, the country’s economic base remains strong, supported by advanced manufacturing, exports, engineering, and high-value services.
Key insight:
Germany’s GDP continues to grow, but future expansion depends increasingly on productivity improvements, innovation, digital transformation, and new industrial sectors.
Germany GDP Map by NUTS 1: Economic Concentration by Federal State
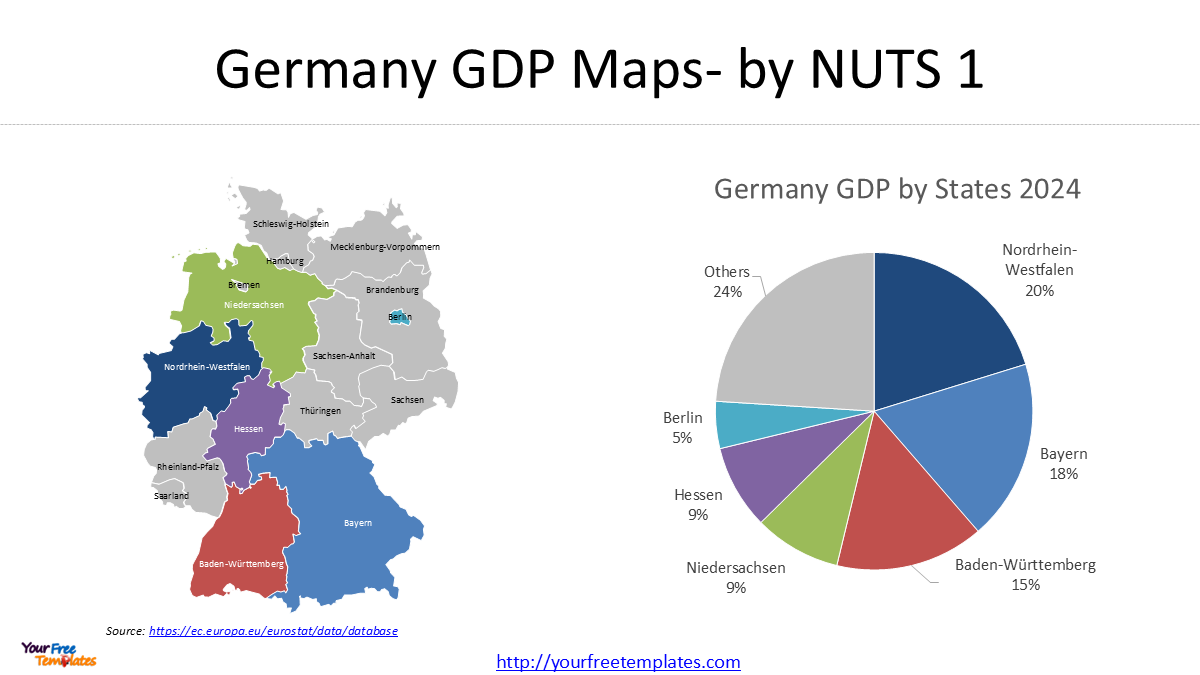
Germany is divided into 16 federal states (Bundesländer), corresponding to the NUTS 1 statistical level.
The NUTS 1 GDP map provides a national overview of where Germany’s economic output is concentrated.
Top 6 German States Account for More Than 70% of GDP
In 2024, Germany’s largest state economies were:
| Rank | State | GDP 2024 (Million €) |
|---|---|---|
| 1 | North Rhine-Westphalia | 875,431 |
| 2 | Bavaria | 797,328 |
| 3 | Baden-Württemberg | 655,472 |
| 4 | Lower Saxony | 383,465 |
| 5 | Hesse | 370,852 |
| 6 | Berlin | 207,852 |
Together, these six states represent more than 70% of Germany’s total GDP.
Economic Interpretation
Germany’s economic power is concentrated in several major regions:
- North Rhine-Westphalia – industrial manufacturing, chemicals, logistics, services
- Bavaria – automotive, technology, aerospace, advanced manufacturing
- Baden-Württemberg – automotive, engineering, machinery
- Hesse – finance, transportation, services
- Berlin – digital economy, startups, government services
The NUTS 1 map is ideal for:
- Executive presentations
- Country-level economic reports
- Investment overview slides
Germany GDP Map by NUTS 2: Regional Economic Leaders
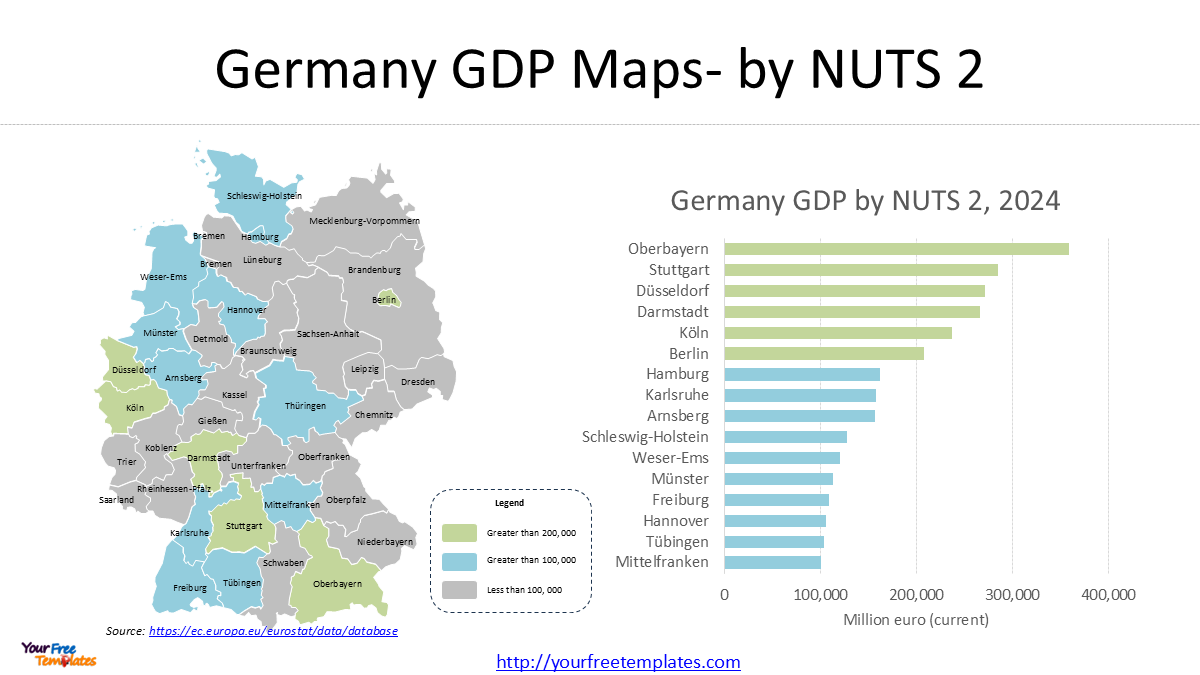
Germany’s 38 NUTS 2 regions show significant differences in economic scale. By classifying regions according to total GDP, the map highlights the concentration of economic activity across Germany.
The 38 NUTS 2 regions are grouped into three GDP categories:
| GDP Category | GDP Range (2024) | Number of Regions | Economic Interpretation |
|---|---|---|---|
| Tier 1: Major Economic Engines | > €200 billion | 6 regions | Germany’s largest regional economies |
| Tier 2: Strong Regional Economies | €100–200 billion | 10 regions | Important industrial and service centers |
| Tier 3: Emerging & Smaller Economies | < €100 billion | 22 regions | Smaller regional economies with diverse development patterns |
Tier 1: Germany’s Major Economic Engines (> €200 Billion)
Only six NUTS 2 regions exceed €200 billion in GDP, representing Germany’s strongest economic centers.
| Region | GDP 2024 (€ million) | Main Economic Drivers |
|---|---|---|
| Oberbayern | 359,141 | Automotive, technology, services |
| Stuttgart | 285,396 | Automotive, machinery, engineering |
| Düsseldorf | 271,328 | Industry, chemicals, services |
| Darmstadt | 266,733 | Finance, pharmaceuticals, chemicals |
| Köln | 236,726 | Industry, media, logistics |
| Berlin | 207,852 | Digital economy, government, services |
Key Insight
These six regions represent Germany’s metropolitan economic core, combining:
- Large urban populations
- High-value industries
- International companies
- Research institutions
Tier 2: Strong Regional Economies (€100–200 Billion)
Ten regions generate between €100 and €200 billion GDP.
Examples:
| Region | GDP 2024 (€ million) |
|---|---|
| Hamburg | 162,581 |
| Karlsruhe | 157,762 |
| Arnsberg | 156,494 |
| Schleswig-Holstein | 127,512 |
| Weser-Ems | 120,883 |
| Münster | 112,830 |
| Freiburg | 108,785 |
| Hannover | 106,077 |
| Tübingen | 103,529 |
| Mittelfranken | 101,079 |
These regions are important contributors to Germany’s economy through:
- Manufacturing
- Logistics
- Export industries
- Renewable energy
- Specialized industrial clusters
Tier 3: Smaller GDP Regions (< €100 Billion)
The remaining 22 NUTS 2 regions have GDP below €100 billion.
This group includes:
- Eastern German regions
- Smaller metropolitan regions
- Rural industrial regions
Examples:
- Leipzig
- Dresden
- Brandenburg
- Mecklenburg-Vorpommern
- Thüringen
- Saarland
Although their total GDP is smaller, many regions have strong growth potential driven by:
- Renewable energy
- Semiconductor investment
- Advanced manufacturing
- Logistics development
Key insight:
Germany’s economic output is highly concentrated among a limited number of NUTS 2 regions. The largest economic centers are primarily located in southern Germany, the Rhine corridor, and major metropolitan areas such as Berlin and Hamburg. However, smaller regions continue to play an important role through specialized industries and emerging investment opportunities
Fastest Growing Germany NUTS 2 Regions (2020–2024)
GDP size and GDP growth tell different stories.
Large economies are not always the fastest-growing regions. To understand economic momentum, this map highlights the Top 10 fastest-growing NUTS 2 regions between 2020 and 2024.
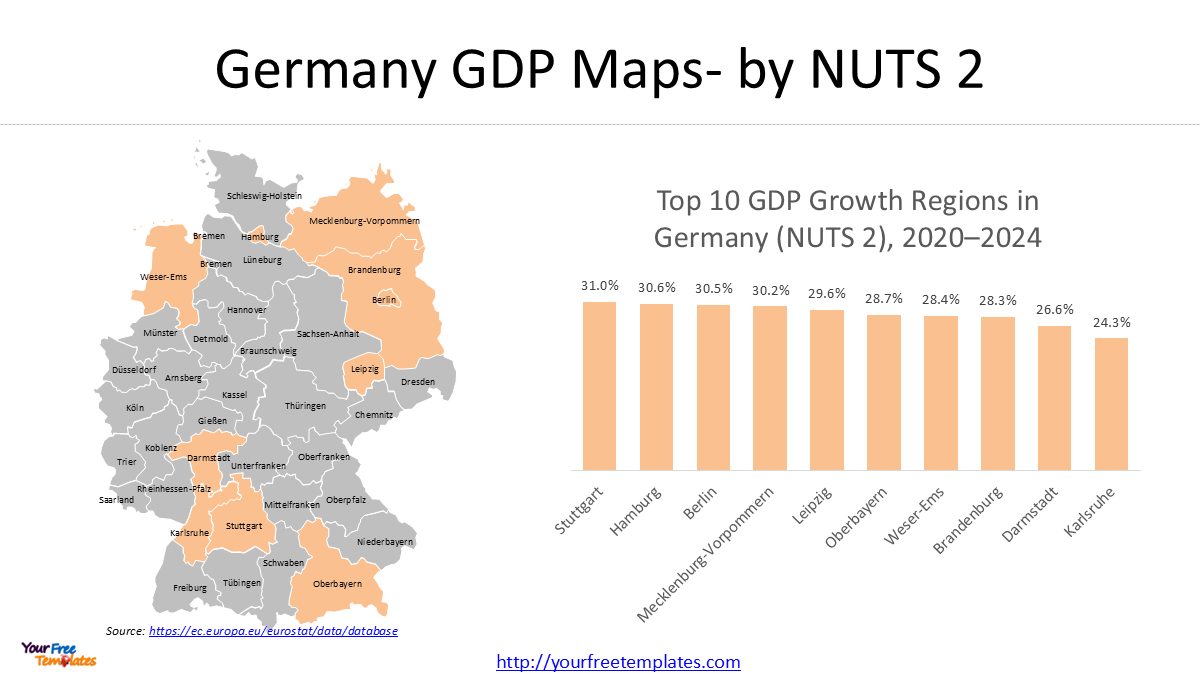
Top Growth Regions
| Rank | Region | GDP Growth Rate |
| 1 | Stuttgart | 31.0% |
| 2 | Hamburg | 30.6% |
| 3 | Berlin | 30.5% |
| 4 | Mecklenburg-Vorpommern | 30.2% |
| 5 | Leipzig | 29.6% |
| 6 | Oberbayern | 28.7% |
| 7 | Weser-Ems | 28.4% |
| 8 | Brandenburg | 28.3% |
| 9 | Darmstadt | 26.6% |
| 10 | Karlsruhe | 24.3% |
Key Insight
Germany’s growth story is broader than traditional economic powerhouses.
While southern Germany remains highly competitive, several eastern German regions and metropolitan areas have achieved strong growth momentum through:
- Technology investment
- Renewable energy
- Logistics development
- New industrial projects
Germany NUTS Map Scale Comparison: Choosing the Right Level of Detail
Creating professional regional maps requires balancing geographic detail and presentation performance.
The Germany NUTS templates are available in different map scales:
- 1:10 Million (10M)
- 1:3 Million (3M)
- 1:1 Million (1M)
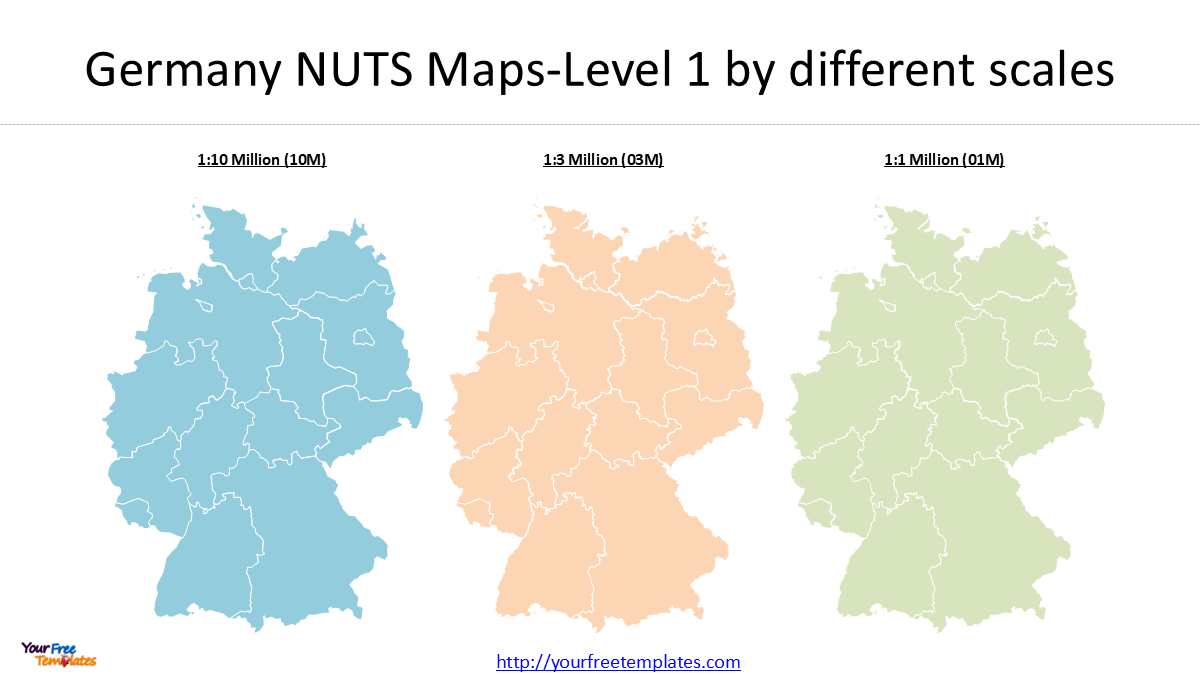
Map Scale Comparison
| Scale | Advantage | Best Use |
| 1:10M | Lightweight, smooth boundaries, fast editing | PowerPoint presentations |
| 1:3M | More geographic detail | Professional reports |
| 1:1M | Highest detail | Large-format maps and GIS applications |
For most business presentations, the 1:10M dataset provides the best balance:
Advantages:
- Smaller file size
- Faster PowerPoint editing
- Cleaner visual appearance
- Smooth regional boundaries
Limitations:
- Less detailed coastline and small geographic features
- Not designed for precise GIS analysis
How to Use Germany GDP Maps in PowerPoint
These templates can support many applications:
Business Strategy
- Market entry analysis
- Investment location comparison
- Regional expansion planning
Economic Research
- GDP comparison
- Regional development analysis
- Growth monitoring
Education
- Geography lessons
- Economic studies
- European regional analysis
Download Germany GDP Map PowerPoint Templates
This Germany GDP Map collection combines economic data with editable geographic templates, allowing users to quickly create professional regional presentations.
Whether you need a Germany state map, NUTS 2 regional analysis, GDP ranking visualization, or economic growth comparison, these templates provide a flexible foundation for data-driven storytelling.
Source data:
- Destatis Germany GDP statistics
- Eurostat regional GDP database
Key Insight
It is worth noting that the 2024 GDP figures from these two sources show slight differences, although both are reported in current euros. The official German statistics provide the national GDP figures, while Eurostat provides regional GDP data based on NUTS 2 regions.
Since NUTS 2 regions are nested within NUTS 1 regions, users can aggregate the regional GDP values from NUTS 2 to NUTS 1 levels through Excel processing or other data analysis tools. NUTS 1, 2, 3 codes of statistical regions is included in Maps – NUTS – Nomenclature of territorial units for statistics – Eurostat. Alternatively, AI-assisted data processing can help quickly classify and summarize NUTS 2 regions into their corresponding NUTS 1 federal states for regional comparison and map visualization.
Looking for Premium maps, please visit our affiliate site: https://editablemaps.com/ or https://ofomaps.com/
Size:490K
Type: PPTX
Germany GDP Map: Regional Economic Performance by NUTS 1 & NUTS 2 Regions (2025) Template
Click the link to download it.
Aspect Ratio: Widescreen 16:9
Click the green button to download it.
Download the 16:9 Template
You may also be interested in our related Germany templates:
- Germany Map with 16 States
- Germany Cities Map
- Highest GDP per Capita German Districts Map
- Germany NUTS Maps (NUTS 1, 2 & 3): Editable PPT Templates & Guide
- Individual state maps for all 16 German federal states