

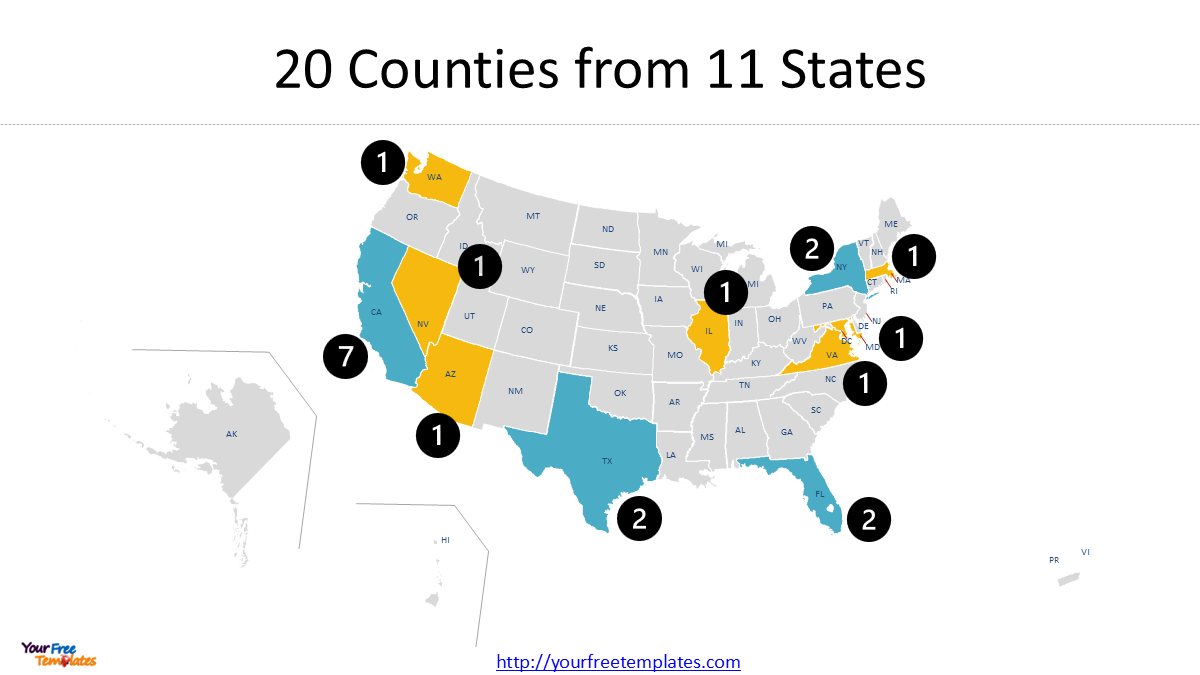
This is The New American Mosaic—a series exploring the evolving geography of American immigration. As we move through 2025, the story is no longer about a single gateway, but about a network of powerful counties where the foreign-born population is concentrating. Driven by new international migration patterns, this shift is fueling unprecedented immigrant population growth in Sun Belt hubs and tech corridors, fundamentally reshaping urban development. We begin with the data: the 20 U.S. counties that form the foundation of this new demographic reality.
At the end of this post, you can download our The New American Mosaic Summary PowerPoint template to fit your purpose. As the same diagram PowerPoint template series, you can also find our 18 Fastest Growing US Counties, Top 12 Most Populous Countries, most dangerous cities in the US, Top 10 U.S. Cities with the Highest Violent Crime Rate, US Consolidated City County
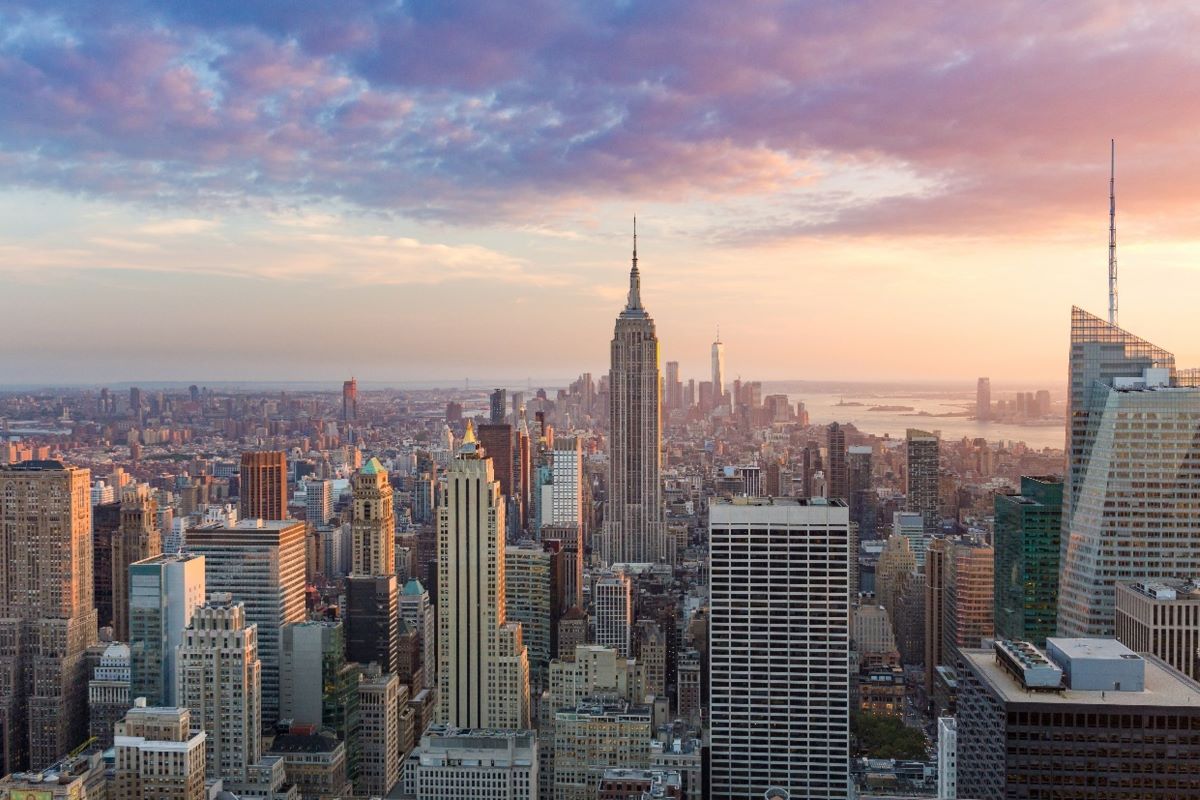
The 20 U.S. Counties Driving Immigrant Population Growth
The following counties aren’t just lists on a spreadsheet. They are the primary arenas where America’s demographic future is being decided. The table below, based on the latest Census estimates and analysis, highlights these critical regions, their major cities, and their growth trajectories—a key indicator of shifting national patterns.
| County | State | Top 3 Cities | Est. Immigrant Growth (2020–2025) & Trend Insight |
|---|---|---|---|
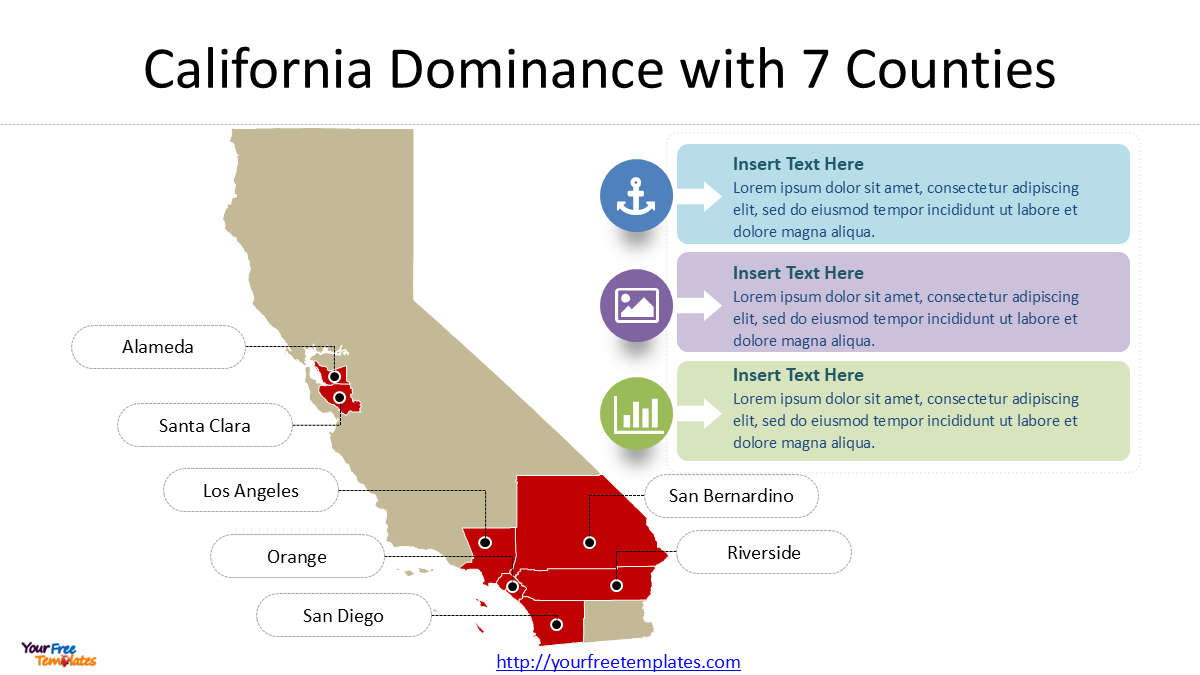
| 1. Los Angeles | CA | Los Angeles, Long Beach, Santa Clarita | Stable / Slowing (+1.5%). The established mega-hub faces affordability pressures, leading to secondary migration. |
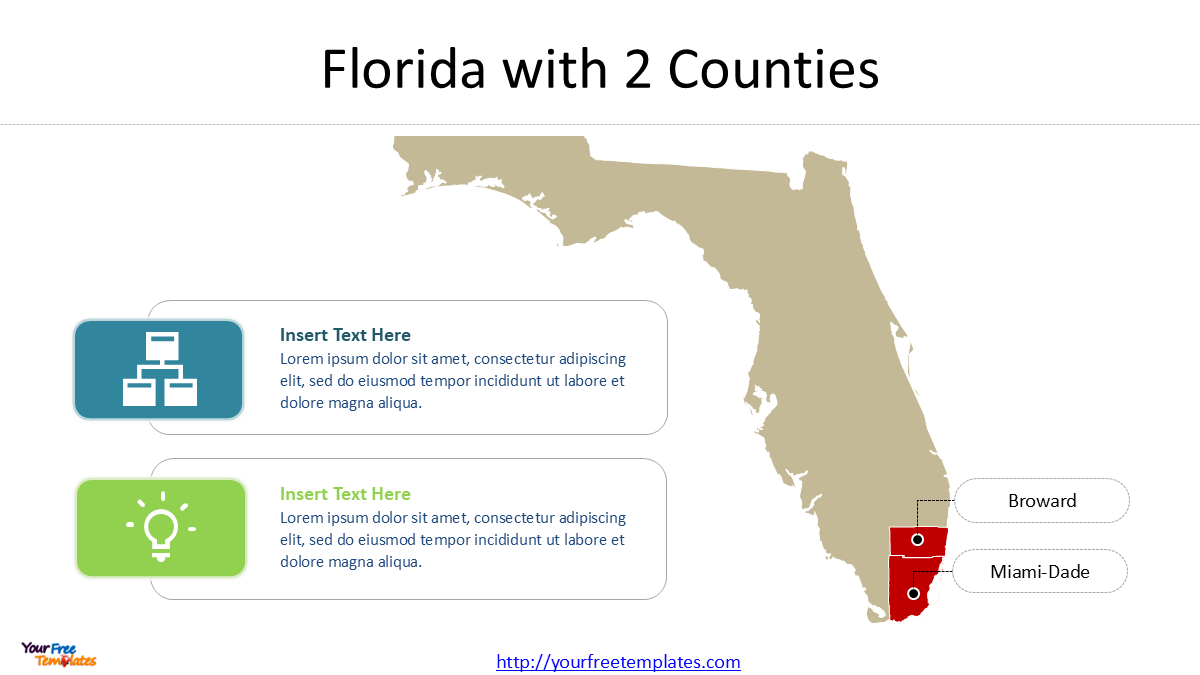
| 2. Miami-Dade | FL | Miami, Hialeah, Miami Gardens | High (+8.2%). Sustained by deep cultural ties and its role as a capital for Latin American business. |
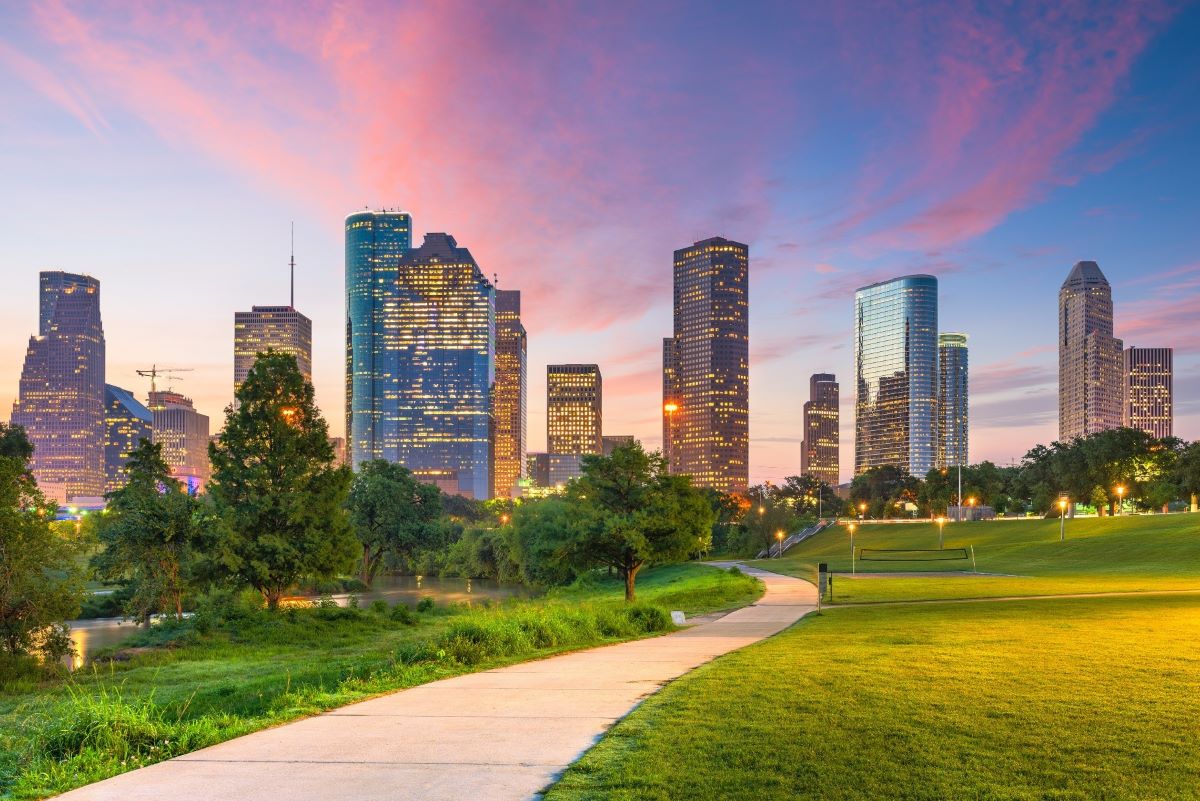
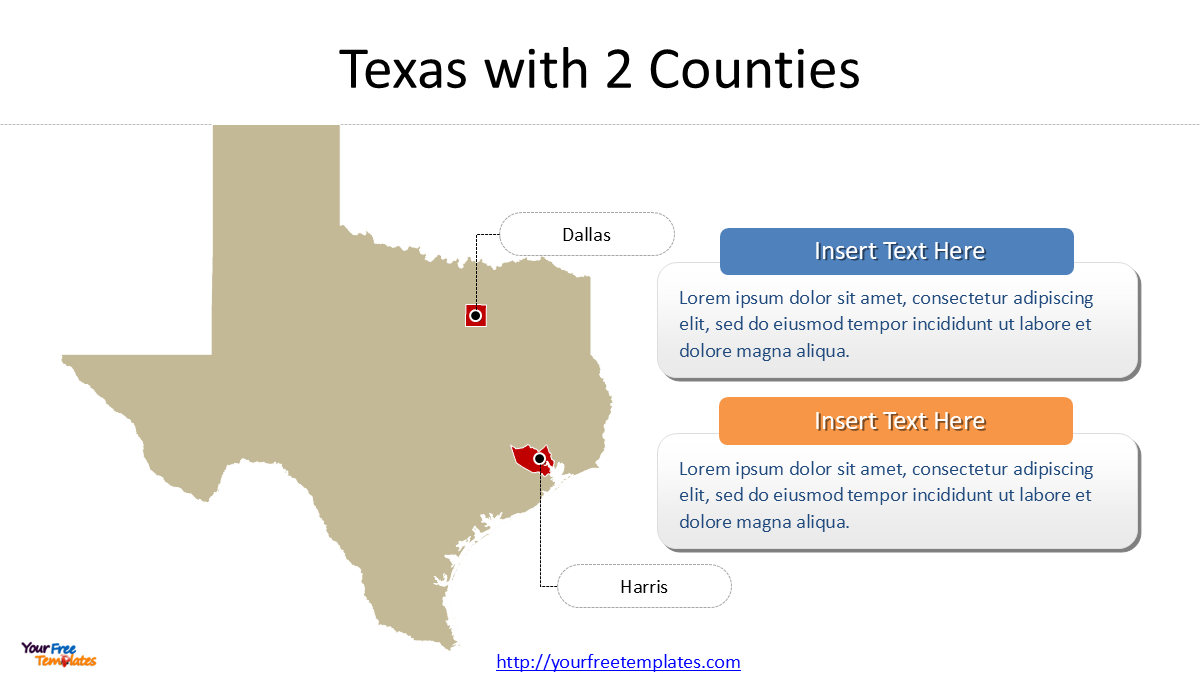
| 3. Harris | FL | Houston, Pasadena, Baytown | Very High (+10.5%). A powerhouse driven by energy, healthcare, and recent international migration patterns from South America. |
| 4. Cook | IL | Chicago, Elgin, Cicero | Stable (+2.1%). A historic hub with diversified sources of growth, including refugee resettlement. |
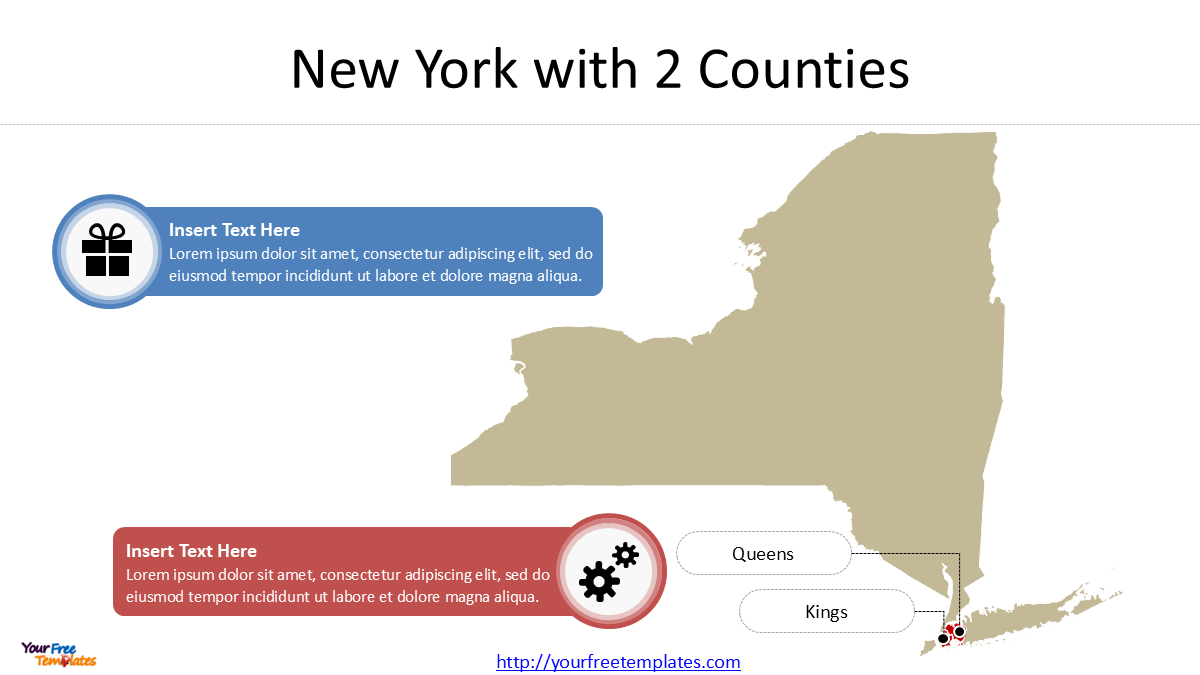
| 5. Queens | NY | NYC (Queens), Long Island City, Flushing | Moderate (+4.3%). The enduring “World’s Borough” continues to be a primary landing spot. |
| 6. Orange | CA | Santa Ana, Anaheim, Irvine | Moderate (+3.8%). Contrasts vibrant established enclaves with high-skilled tech corridors. |
| 7. Kings (Brooklyn) | NY | NYC (Brooklyn) | Moderate (+4.1%). Growth persists through family networks and cultural economy strength. |
| 8. San Diego | CA | San Diego, Chula Vista, Oceanside | Moderate (+5.2%). Proximity to the border and a strong military-tech economy shape its flow. |
| 9. Maricopa | AZ | Phoenix, Mesa, Chandler | Very High (+11.2%). The epicenter of the “Sun Belt surge,” attracting domestic and international migrants alike. |
| 10. Dallas | TX | Dallas, Irving, Grand Prairie | High (+9.4%). Corporate relocation and booming infrastructure drive demand for diverse labor. |
| 11. Broward | FL | Fort Lauderdale, Pembroke Pines, Hollywood | High (+7.6%). Benefits from both spillover from Miami and direct international arrivals. |
| 12. Santa Clara | CA | San Jose, Sunnyvale, Santa Clara | High, Tech-led (+6.5%). Global talent for the tech industry defines its immigrant population growth. |
| 13. King | WA | Seattle, Bellevue, Kent | High (+8.9%). Similar to Santa Clara, with growth anchored in aerospace and software. |
| 14. Riverside | CA | Riverside, Moreno Valley, Corona | Very High, Spillover (+10.1%). Directly fueled by affordability seekers from coastal CA counties. |
| 15. Clark | NV | Las Vegas, Henderson, North Las Vegas | High (+9.1%). Hospitality and construction booms pull in a vast international workforce. |
| 16. Fairfax | VA | Herndon, Vienna, Fairfax City | Moderate (+5.5%). A hub for educated immigrants tied to the DC policy, tech, and defense sectors. |
| 17. San Bernardino | CA | San Bernardino, Fontana, Ontario | High (+8.4%). The logistics and warehouse capital of the Inland Empire, a major employment magnet. |
| 18. Alameda | CA | Oakland, Fremont, Hayward | Moderate (+4.7%). A diverse blend of tech, healthcare, and long-standing Asian and Latino communities. |
| 19. Montgomery | MD | Rockville, Gaithersburg, Takoma Park | Moderate (+5.1%). Known for high education levels and proximity to federal research institutions. |
| 20. Middlesex | MA | Cambridge, Lowell, Framingham | Moderate (+4.8%). World-class universities and bio-tech drive steady, high-skill immigration. |
The Forces Shaping International Migration Patterns
The clustering of immigrants in these 20 counties is driven by a complex interplay of economic, social, and structural factors.
-
The Tech and Education Magnet: In counties like Santa Clara (CA), King (WA), and Middlesex (MA), the primary driver is the demand for high-skilled labor. These regions attract “H-1B” visa holders and international students who often transition into the local workforce, fueling innovation in software, biotechnology, and aerospace.
-
The “Sun Belt” Logistics Boom: As the cost of living skyrockets in traditional hubs like New York and Los Angeles, many immigrants are moving to (or arriving directly in) counties like Harris (TX), Maricopa (AZ), and Riverside (CA). These areas offer more affordable housing and a massive demand for labor in construction, logistics, and the service sector.
-
Family Reunification and Established Enclaves: Historical “gateway” counties like Queens (NY) and Miami-Dade (FL) continue to grow due to established social networks. New arrivals often choose these locations because of the presence of existing diaspora communities, which provide a “soft landing” through linguistic familiarity and cultural support systems.
-
Refugee Resettlement and Humanitarian Parole: In recent years (2022–2024), specific humanitarian crises have led to surges in certain counties. Harris County (TX) and Cook County (IL) have become significant hubs for refugee resettlement and asylum seekers, supported by robust non-profit infrastructures.
The Future of Urban Development and Demographic Change
As we look toward the latter half of the decade, three major trends are expected to redefine the immigrant experience in these counties:
-
Policy Shifts and Enforcement: Data from early 2025 suggests that federal policy changes regarding border security and interior enforcement may slow the net growth of the foreign-born population for the first time in decades. Counties with high undocumented populations may see a shift toward “voluntary emigration” or a slowdown in new arrivals.
-
Internal “Secondary” Migration: We are seeing a “spillover effect” where immigrants who initially settled in Los Angeles or New York are moving to “secondary” counties like San Bernardino (CA) or Broward (FL). This is driven by the search for homeownership and better public education, mimicking the traditional American suburban flight.
-
Aging Workforce Dependency: Despite political debates, the economic reality is that many of these 20 counties have aging native-born populations. Immigrants are increasingly filling critical gaps in healthcare, elderly care, and infrastructure maintenance. In counties like Fairfax (VA) and Montgomery (MD), the foreign-born population is projected to be the sole source of labor force growth through 2030.
Series Roadmap: A Deep Dive into America’s New Mosaic
Over the next six episodes, we will dive deep into these statistics to tell the human stories behind the data. Each episode will group three to four counties to explore their unique identities:
-
Episode 1: The Mega-Gateways (Los Angeles, Cook, Harris, Miami-Dade) — Exploring the four largest hubs and how they manage massive infrastructure and social service demands.
-
Episode 2: The New York Mosaic (Queens, Kings, Bronx) — A look at the “World’s Borough” and the enduring power of the Northeast corridor.
-
Episode 3: The California Powerhouses (Orange, San Diego, Riverside) — Examining the diverse immigrant economies of Southern California, from tech to trade.
-
Episode 4: Innovation Corridors (Santa Clara, King, Middlesex) — How the world’s brightest minds are shaping the future of Silicon Valley, Seattle, and Boston.
-
Episode 5: The Desert & Sun Belt Surge (Maricopa, Dallas, Clark) — Why the interior West and Texas are the new “promised lands” for international arrivals.
-
Episode 6: The Suburban Gateways (Fairfax, Montgomery, Alameda, San Bernardino) — Analyzing the shift of immigrant communities into the affluent and industrial suburbs.
 Join us as we move beyond the numbers to understand how these 20 counties are actively shaping the next generation of American life.
Looking for Premium maps, please visit our affiliate site: https://editablemaps.com/ or https://ofomaps.com/
Size:542K
Type: PPTX
The New American Mosaic Template
Click the link to download it.
Aspect Ratio: Widescreen 16:9
Click the green button to download it.
Download the 16:9 Template