
Greenland map download with four editable PowerPoint versions gives you a practical way to compare how Greenland appears under different coordinate reference systems and map projections. Because Greenland is located at a very high latitude and covers a vast geographic area, the choice of projection can significantly affect the shape and appearance of the map.
Greenland has also attracted increased international attention because of recent tensions between the United States and Denmark over Greenland’s strategic and security role. In September 2026, the United States, Denmark, and Greenland signed an agreement strengthening Arctic and North Atlantic security while reaffirming the sovereignty of the Kingdom of Denmark and Greenland’s right to self-determination.
For this Greenland map download, I created four editable PowerPoint slides using four different coordinate reference systems. Each slide includes the island outline and the administrative boundaries of Greenland’s five municipalities.
- EPSG:3413 — WGS 84 / NSIDC Sea Ice Polar Stereographic North
- EPSG:5938 — WGS 84 / EPSG Greenland Polar Stereographic
- EPSG:32624 — WGS 84 / UTM Zone 24N
- EPSG:4747 — GR96 / Greenland Reference 1996
The five municipalities are:
- Avannaata Kommunia
- Kommune Kujalleq
- Kommune Qeqertalik
- Qeqqata Kommunia
- Kommuneqarfik Sermersooq
The purpose is not simply to provide four versions of the same map. The four slides demonstrate how Greenland can be represented for different mapping and presentation purposes.
What’s Included in the Greenland Map Download?
| Slide | Coordinate System | Projection | Typical Application |
|---|---|---|---|
| 1 | EPSG:3413 | Polar Stereographic North | Arctic and polar mapping |
| 2 | EPSG:5938 | Greenland Polar Stereographic | Greenland-focused maps |
| 3 | EPSG:32624 | UTM Zone 24N | Regional/local GIS work |
| 4 | EPSG:4747 | GR96 Geographic CRS | Surveying, mapping and geographic coordinates |
All four versions are provided as editable PowerPoint map graphics, allowing users to change colors, add labels, highlight regions and combine the map with other presentation content.
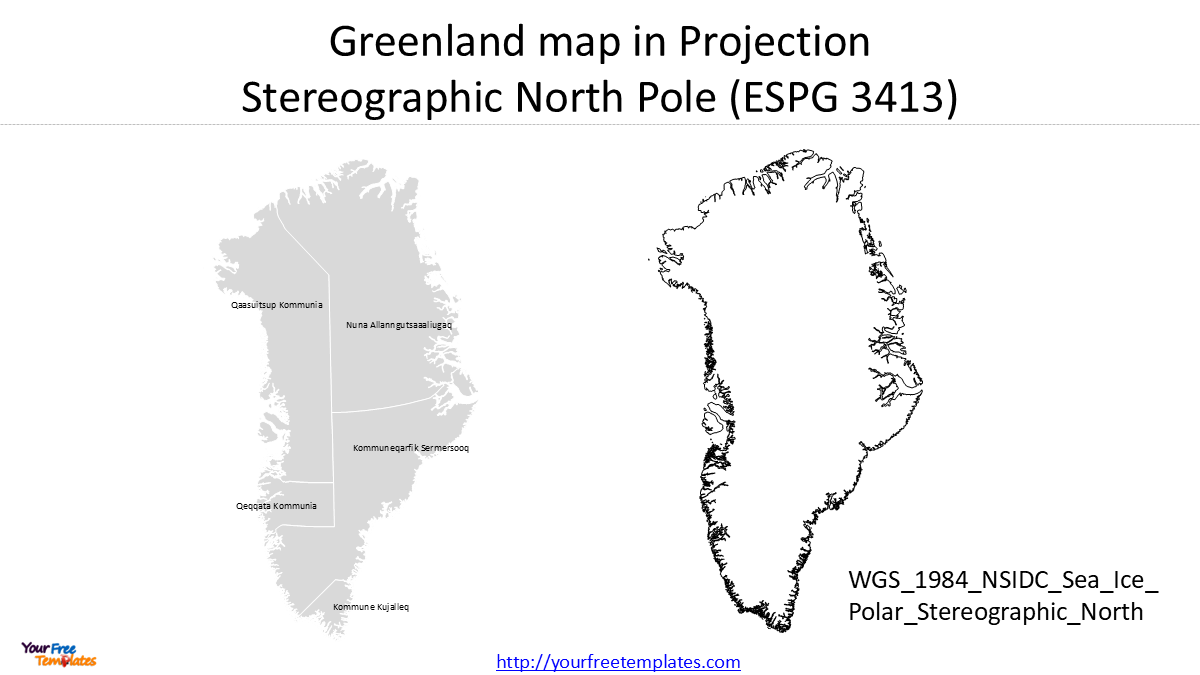
Slide 1: Greenland in EPSG:3413
The first map uses EPSG:3413, WGS 84 / NSIDC Sea Ice Polar Stereographic North.
This is a polar stereographic projected CRS designed for the Northern Hemisphere, particularly applications north of 60°N. EPSG identifies polar research as part of its scope, making it especially relevant to Arctic mapping and sea-ice-related work.
For Greenland, this projection produces a distinctly Arctic-oriented appearance. It is useful when Greenland is being presented together with the Arctic region rather than as an isolated administrative territory.
Useful applications
- Arctic maps
- Polar research presentations
- Sea-ice and climate-related maps
- Arctic geographic studies
- Greenland and North Pole regional maps
If your presentation is about Greenland’s position in the Arctic, EPSG:3413 is particularly appropriate.
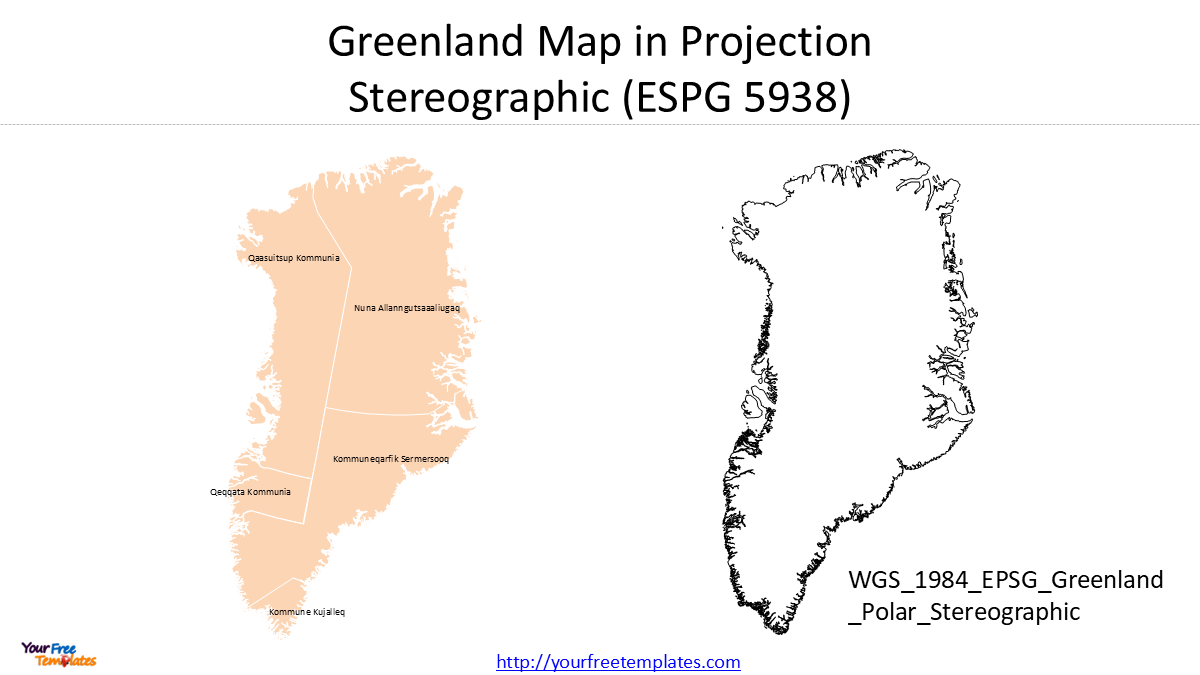
Slide 2: Greenland in EPSG:5938
The second version uses EPSG:5938, WGS 84 / EPSG Greenland Polar Stereographic.
This is another polar stereographic CRS specifically associated with Greenland and the high-latitude Arctic region. Unlike a general geographic latitude/longitude map, the projected geometry provides a more practical Greenland-centered representation.
This version is useful when Greenland itself is the main subject rather than the wider Arctic.
Useful applications
- Greenland maps
- Geography presentations
- Greenland regional analysis
- Educational maps
- PowerPoint presentations where Greenland is the main geographic focus
For a Greenland map download, this is one of the most natural projections to include because it gives users a Greenland-focused projected version without requiring them to work with geographic coordinates directly.
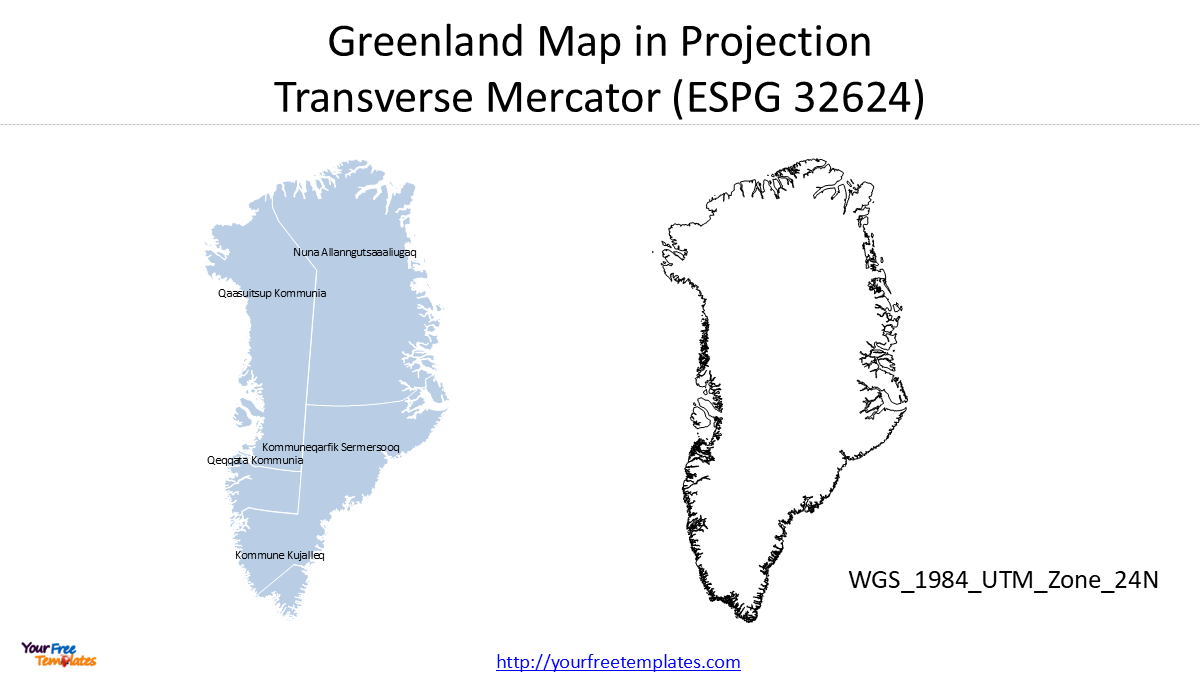
Slide 3: Greenland map in EPSG:32624
The third map uses EPSG:32624, WGS 84 / UTM Zone 24N.
UTM divides the world into longitudinal zones, and Zone 24N covers a portion of Greenland and surrounding areas. This makes it useful for GIS work where a local or regional projected coordinate system is needed.
However, it is important not to treat UTM Zone 24N as a universal Greenland projection. Greenland extends across a very large east-west range, so a single UTM zone does not provide the same regional suitability everywhere.
Useful applications
- GIS projects covering part of Greenland
- Regional mapping
- Local spatial analysis
- Data-processing workflows
- Projects where the source data already uses UTM Zone 24N
This slide is therefore more useful as a GIS-oriented reference than as the default projection for a whole-Greenland presentation.
Slide 4: Greenland in GR96 / EPSG:4747
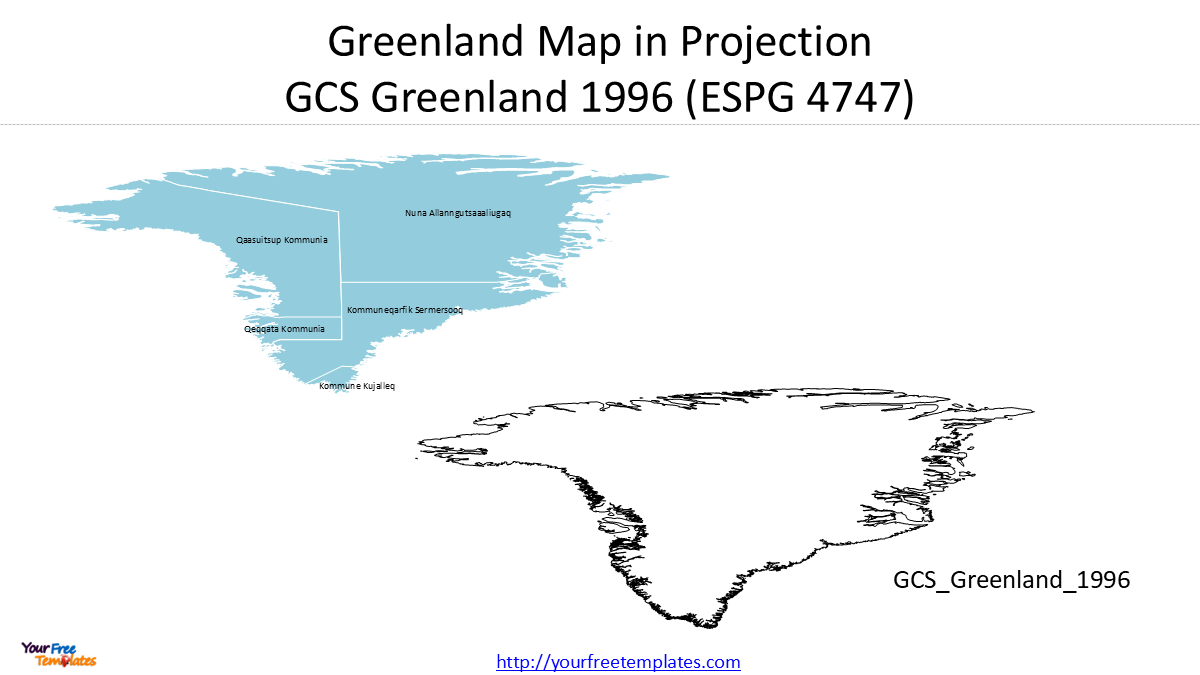
The fourth version uses EPSG:4747, GR96 / Greenland Reference 1996.
Unlike the first three projected coordinate systems, EPSG:4747 is a geographic CRS, using latitude and longitude rather than projected metre coordinates. EPSG describes GR96 as a CRS for Greenland with applications including cadastral, engineering survey and topographic mapping.
This makes the fourth slide particularly useful for understanding the difference between a projected map and a geographic CRS.
Useful applications
- Geographic coordinate data
- Surveying and mapping
- Cadastral applications
- Topographic mapping
- GIS datasets using GR96
For PowerPoint users, this version can also be useful when comparing the appearance of a geographic-coordinate dataset with projected Greenland maps.
Comparing the Four Greenland Map Projections
The four slides are not intended to identify one universally “correct” Greenland projection. Instead, they show that the appropriate CRS depends on what you are trying to do.
EPSG:3413 is strongly associated with Arctic and polar applications.
EPSG:5938 provides a Greenland-focused polar stereographic representation.
EPSG:32624 is useful for regional GIS work within UTM Zone 24N.
EPSG:4747 provides Greenland’s GR96 geographic coordinate reference system.
This distinction matters when downloading GIS data. Two datasets can represent exactly the same geographic boundary but appear different after being projected into different coordinate systems.
Greenland GIS Data Sources: An Important Practical Lesson
Finding Greenland GIS data is not necessarily the same as finding a convenient downloadable vector dataset.
One source that frequently appears in Greenland GIS searches is NunaGIS. It is important to make one distinction clear: NunaGIS does provide genuine GIS web services. Its official documentation lists ArcGIS REST, WFS, WMS and Vector Tile services, and its Technical Base Map and Topographic Map are described as vector data.
Its ArcGIS REST infrastructure also exposes administrative-boundary services and other datasets. For example, the NunaGIS administrative-boundaries service contains municipality boundaries and supports several query formats.
However, there is a practical difference between having GIS data available through a web service and being able to quickly download the polygon features as a clean Shapefile for further editing.
For this project, I spent considerable time trying to extract the Greenland administrative boundaries from NunaGIS. What I could readily obtain through some of the map/export workflows was a rendered map or image representation, rather than the simple editable polygon dataset I wanted for the QGIS → Illustrator → PowerPoint workflow.
The problem, therefore, is not that NunaGIS lacks GIS data. The problem is that extracting the underlying features in the most convenient format can require additional knowledge of the particular REST/WFS service, query structure and GIS workflow.
That distinction is important if your goal is not simply to view a Greenland map, but to obtain editable vector shapes.
A More Practical Downloadable Data Source
For this particular PowerPoint project, I found the Humanitarian Data Exchange (HDX) / Who’s On First (WOF) Greenland dataset much more convenient as a starting point.
The WOF administrative dataset is designed around administrative polygons and human settlements. WOF data is aggregated and standardized from multiple sources and is distributed through HDX for individual countries.
For my Greenland map, the important advantage was practical: I could obtain administrative boundary shapes and continue the workflow in desktop GIS rather than spending substantial time working through a web-map service.
This does not mean that HDX/WOF is necessarily more authoritative than Greenland’s own geographic-information infrastructure. It means that for a specific workflow—download vector boundaries → process them in QGIS → create editable PowerPoint graphics—a ready-to-use dataset can be considerably more convenient.
From GIS Data to an Editable PowerPoint Map
My practical workflow for this Greenland map was:
HDX/WOF data → ArcGIS → select/reproject data → export vector graphics as EMF file → PowerPoint
The key point is to choose the CRS before producing the final PowerPoint artwork.
For example:
- Use EPSG:3413 when the map needs an Arctic/polar context.
- Use EPSG:5938 for a Greenland-focused polar representation.
- Use EPSG:32624 when the GIS project is appropriate for UTM Zone 24N.
- Use EPSG:4747 when the source or application requires Greenland Reference 1996 geographic coordinates.
After the GIS geometry has been prepared, it can be converted into editable vector artwork and brought into PowerPoint.
With the EMF file, simply copy it into PowerPoint and ungroup the graphic to access all the individual shapes. You can then copy only the shapes and text you need to your slide—that’s all.
Download the Greenland Map PowerPoint Template
If you are creating your own Greenland map from GIS data, the most important lesson is not simply which projection to choose. It is also where to obtain the underlying vector features and whether the data source can be efficiently converted into the editable geometry you actually need.
This Greenland map download includes four editable versions:
- Greenland Map — EPSG:3413
- Greenland Map — EPSG:5938
- Greenland Map — EPSG:32624
- Greenland Map — EPSG:4747 / GR96
The four slides provide a practical comparison of Greenland under different coordinate reference systems and are intended for presentations, geographic analysis, GIS-related projects, education and map design.
Looking for Premium maps, please visit our affiliate site: https://editablemaps.com/ or https://ofomaps.com/
Size:940K
Type: PPTX
Greenland map download Template
Click the link to download it.
Aspect Ratio: Widescreen 16:9
Click the green button to download it.
Download the 16:9 Template