The Fishbone Diagram Template includes three slides. Ishikawa diagrams (also called fishbone diagrams, herringbone diagrams, cause-and-effect diagrams, or Fishikawa) are causal diagrams created by Kaoru Ishikawa (1968) that show the causes of a specific event. You can check our model templates including SWOT analysis, AIDA model, Porter’s five forces template, Blockchain technology PowerPoint templates, and Harnessing the Power of the McKinsey 7S Framework for Optimal Organizational Efficiency.
The Fishbone Diagram Template includes three slides.
Slide 1, The Fishbone Diagram Template with 5 Ms (used in manufacturing industry).
The Fishbone Diagram, also known as the Ishikawa or Cause and Effect Diagram, is a powerful tool used in process improvement and problem-solving. It helps teams visually identify and explore potential causes of a particular problem, facilitating a thorough analysis. The diagram resembles the skeleton of a fish, with the problem statement at the head and the potential causes branching off the spine into various categories, commonly referred to as the 5 Ms: Machine, Method, Material, Mind Power, and Measurement/Medium.
- Machine (Technology): This category encompasses issues related to equipment, technology, and tools used in the process. Problems might arise from outdated technology, equipment failures, or inefficient machinery, impacting the quality or efficiency of the output.
- Method (Process): This branch looks at the procedures and processes in place. It includes the steps taken to complete a task, workflow inefficiencies, or lack of standard operating procedures that could lead to inconsistencies or errors.
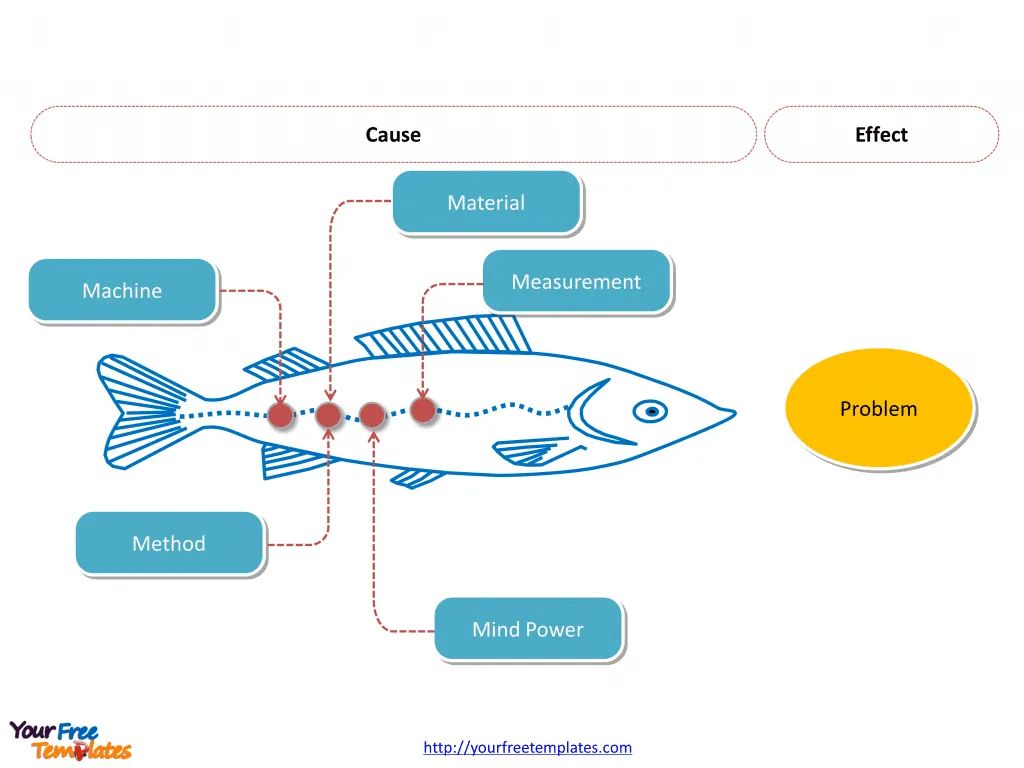
- Material: This aspect considers the inputs used in the process, including raw materials, consumables, and information. Issues might include poor quality materials, incorrect specifications, or inadequate supply, which can affect the final product or service.
- Mind Power (Brain Work): This category focuses on human factors, such as skills, knowledge, and attitudes of the workforce. Challenges might be insufficient training, lack of motivation, or communication barriers, impacting the effectiveness of the process.
- Measurement/Medium: This branch examines the tools and methods used for inspection and the environment in which the process operates. Inaccurate measurements, faulty inspection equipment, or unsuitable environmental conditions can lead to discrepancies in quality or performance.
By systematically evaluating each of these categories, teams can identify root causes of problems and develop targeted solutions, leading to significant improvements in process quality and efficiency. The Fishbone Diagram, with its comprehensive approach, serves as an essential tool for quality management and continuous improvement initiatives.
Slide 2, The Fishbone Diagram Template with 8 Ps (used in marketing industry).
The Fishbone Diagram, expanded to account for the 8 Ps, is an adaptation of the traditional cause-and-effect diagram tailored for analyzing issues within marketing contexts. This variant is particularly useful in dissecting problems related to product or service delivery, offering a structured approach to identify underlying causes and implement effective solutions. The 8 Ps include Product/Service, Price, Place, Promotion, People/Personnel, Process, Physical Evidence, and Packaging.
- Product/Service: This category examines the actual goods or services offered, considering issues like design, features, quality, or variety that might affect customer satisfaction or market performance.
- Price: This branch looks into pricing strategies and their competitiveness, affordability, or perceived value to the customer, addressing how pricing affects demand or profitability.
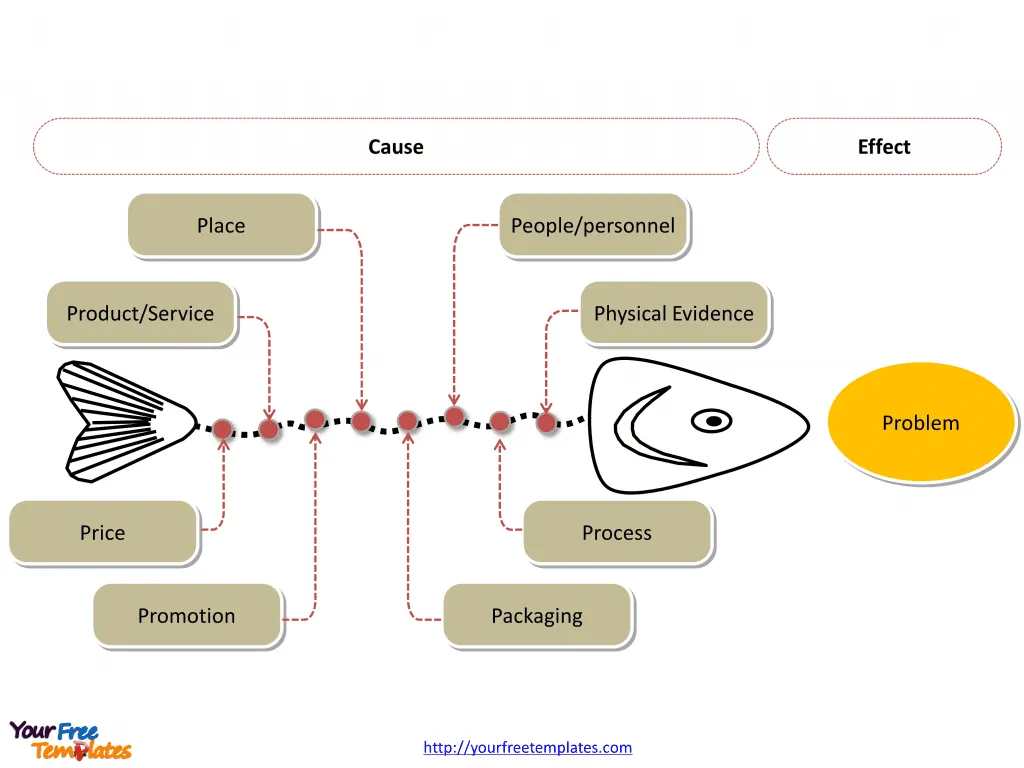
- Place: This aspect covers the distribution and accessibility of the product or service, evaluating the effectiveness of the channels used to reach the target market.
- Promotion: This category analyzes the promotional activities and communications used to market the product or service, identifying gaps or inefficiencies in advertising, sales promotions, or public relations efforts.
- People/Personnel: This focuses on the human element, including customer service and staff competence, assessing how personnel interactions influence customer experience and satisfaction.
- Process: Here, the operational procedures and workflows that deliver the product or service to the customer are scrutinized for efficiency, reliability, and quality.
- Physical Evidence: This branch considers the tangible aspects that support the service, like the physical environment or online platforms, which can impact customer perceptions and experiences.
- Packaging: This examines how the product is presented, including its design, functionality, and appeal, and how packaging contributes to the product’s overall attractiveness and protection.
By exploring these 8 Ps within the Fishbone Diagram framework, businesses can gain comprehensive insights into marketing-related problems, facilitating targeted strategies to enhance product/service offerings, customer satisfaction, and market competitiveness.
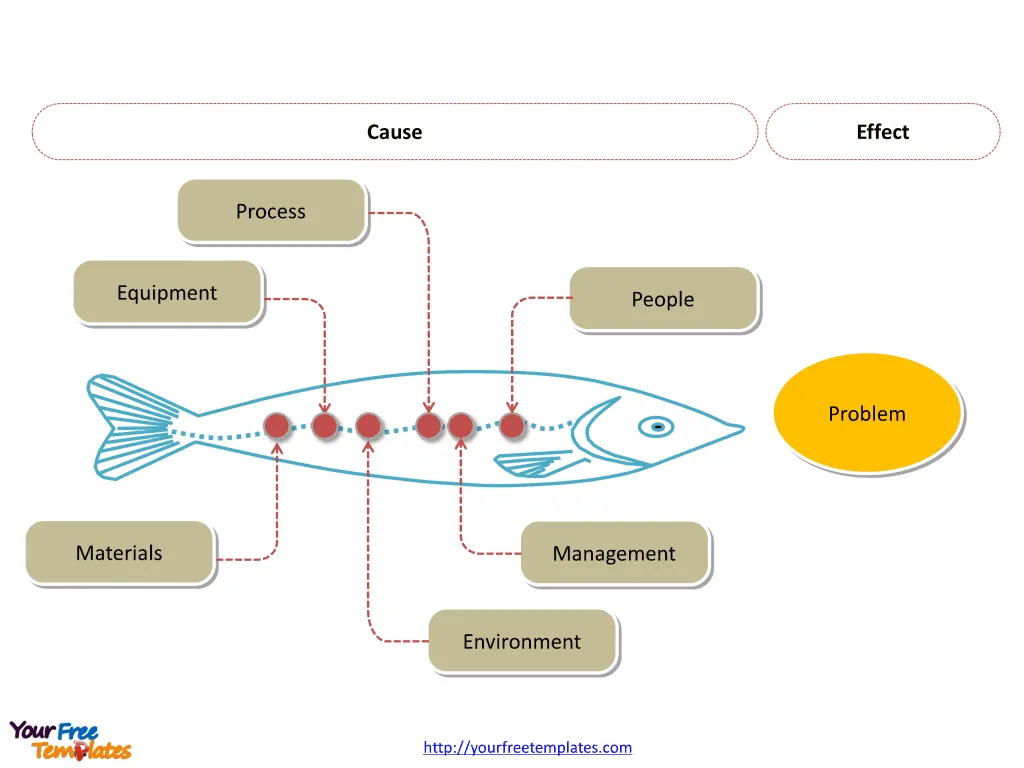
Slide 3, Fishbone Diagram Template of Ishikawa diagram.
The Ishikawa Diagram, also known as the Fishbone Diagram, is a visual tool used for identifying and analyzing various causes contributing to a specific problem. It systematically categorizes potential factors into six primary areas: Equipment, Process, People, Materials, Environment, and Management.
- Equipment refers to the tools and machinery used;
- Process involves the steps or procedures followed;
- People highlights the human elements, including skills and attitudes;
- Materials pertain to the inputs required;
- Environment encompasses the physical and organizational setting; and
- Management focuses on leadership and decision-making practices.
By examining these areas, the Ishikawa Diagram helps teams identify root causes of issues, facilitating targeted solutions to enhance outcomes.
Looking for Premium maps, please visit our affiliate site: https://ofomaps.com/
Size:116K
Type: PPTX
Aspect Ratio: Standard 4:3
Click the blue button to download it.
Download the 4:3 Template
Aspect Ratio: Widescreen 16:9
Click the green button to download it.
Download the 16:9 Template

