


Most Dangerous Cities in the U.S.: A Deep Dive into Total Crime Rates
When Americans search for the “most dangerous cities in the U.S.” or look up “total crime rate by city,” they’re seeking a clear, data-driven picture of urban safety. Total crime rate, which combines both violent offenses (like assault and robbery) and property crimes (like theft and burglary), offers a broad lens to understand the crime landscape.
This analysis of the top 10 high crime cities in America goes beyond the numbers to explore the underlying factors—from economic hardship and gang activity to housing crises and drug epidemics—that fuel these statistics. Whether you’re researching “crime statistics by city” for a move, a visit, or general awareness, this guide provides the context you need.
At the end of this post, you can download our most dangerous cities in the US boundary PowerPoint template to fit your purpose. As the same diagram PowerPoint template series, you can also find our Top 10 U.S. Cities with the Highest Violent Crime Rate, US Consolidated City County, McKinsey Seven Degrees Framework, Lean Startup Canvas, ADKAR Model, rms market share, Energy-as-a-Service, the impact of climate change on international business strategies, Blockchain in Renewable Energy, SPACE Matrix, Bowman’s Strategy Clock, Value Chain Analysis,
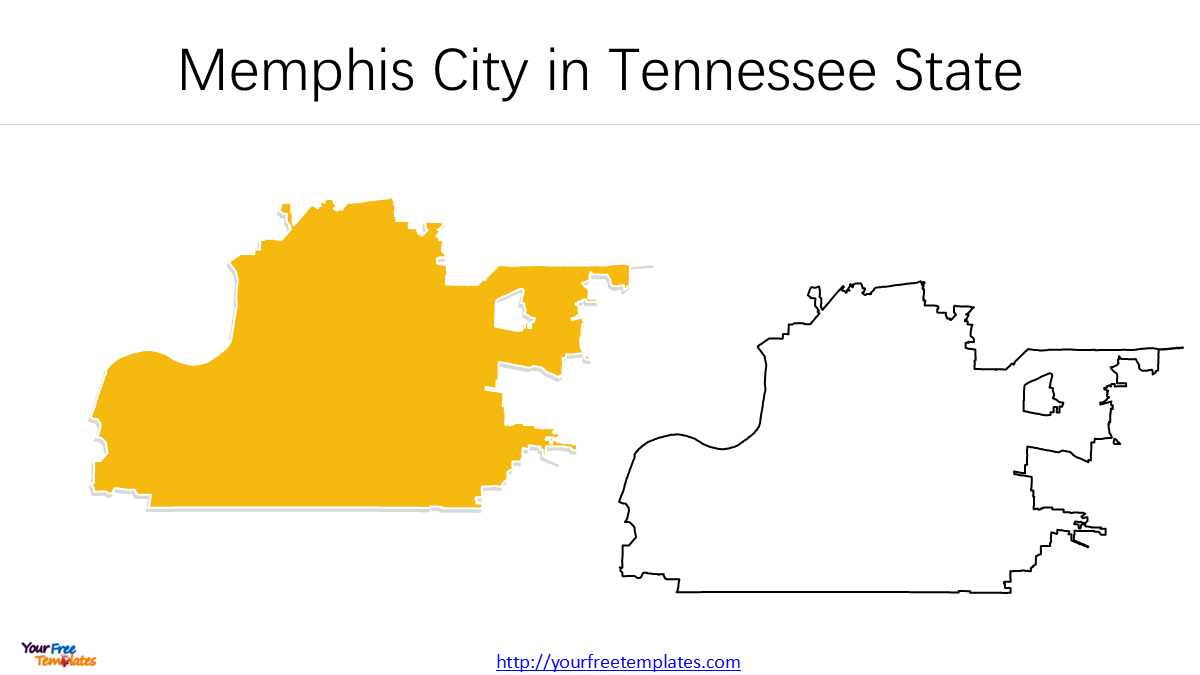
1. Memphis, Tennessee
-
Total Crime Rate: 9,400.3 per 100,000
Memphis doesn’t just top the list; it sets a troubling benchmark. The city’s staggering rate is driven by a dual crisis: high violent crime rooted in gang conflicts and drug trafficking, and pervasive property crime. As a major national logistics hub, its interstate system facilitates criminal enterprise, while deep-seated poverty and a strained police-community relationship create a challenging environment for sustainable safety improvements.
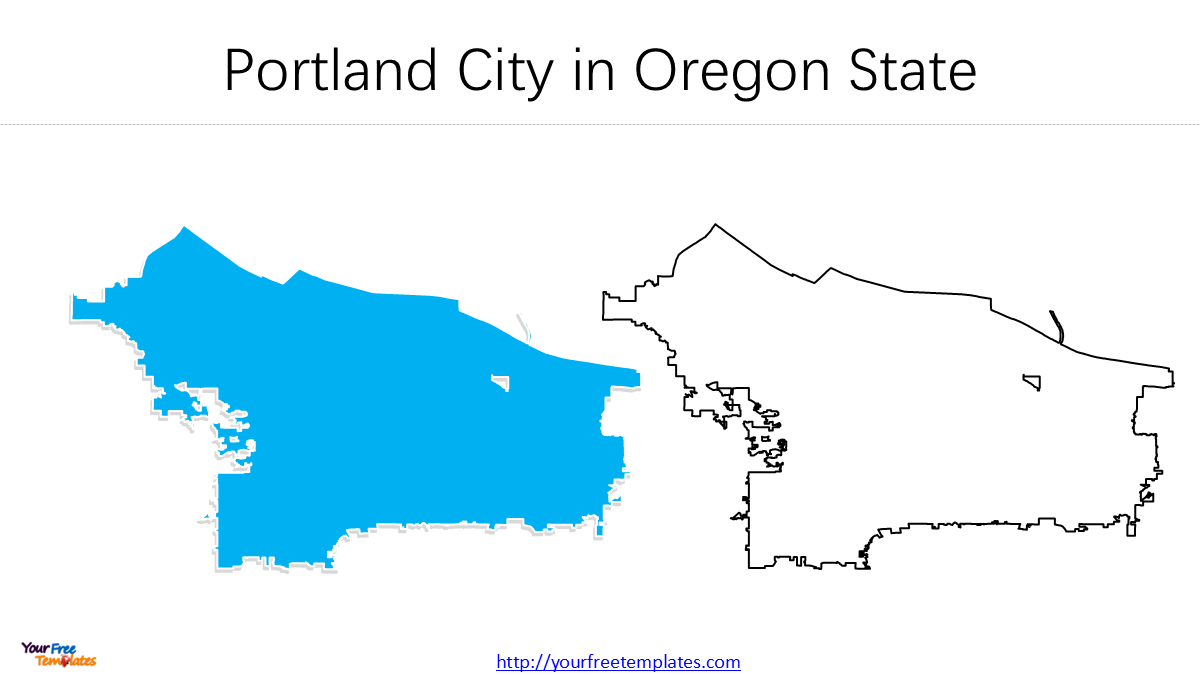
2. Portland, Oregon
-
Total Crime Rate: 6,246.4 per 100,000
Portland represents a modern urban dilemma. Its high ranking is almost entirely propelled by a dramatic surge in property crime. The city’s severe affordability and homelessness crises have created a perfect storm, with issues like car theft, burglary, and larceny becoming commonplace. While its violent crime rate is moderate, the sheer volume of property offenses pushes it to the top of the list, making it a focal point in searches for “high crime cities in America.”
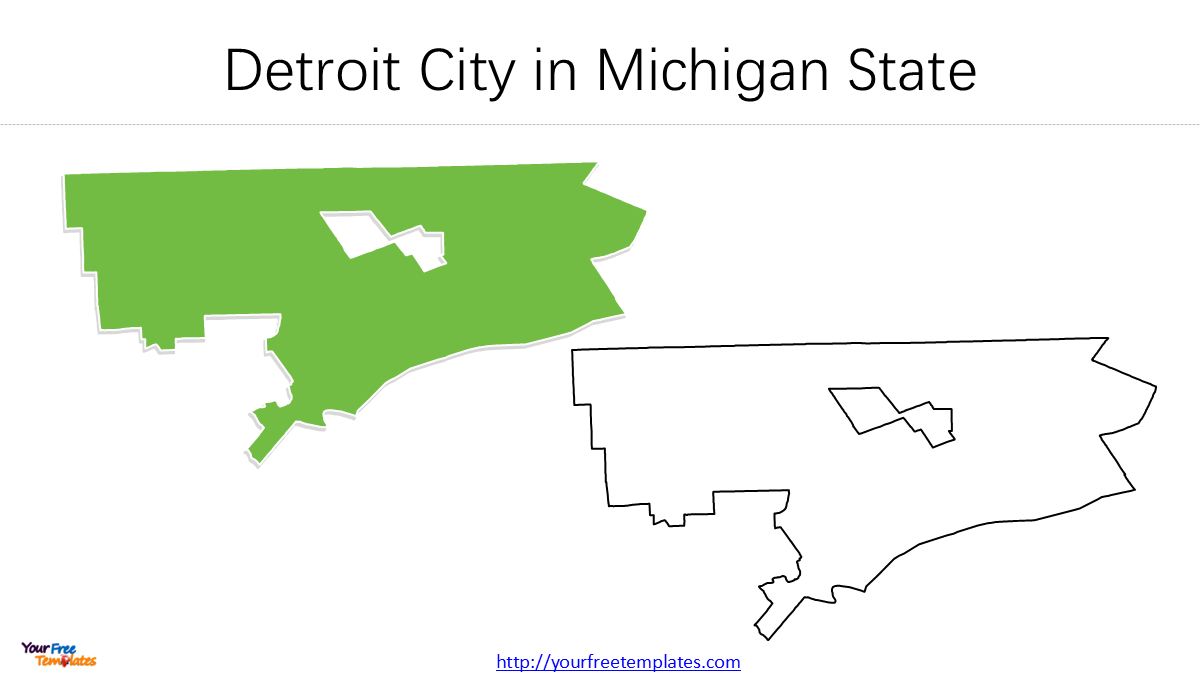
3. Detroit, Michigan
-
Total Crime Rate: 6,086.6 per 100,000
Detroit’s presence on this list is a story of legacy challenges meeting renewal. The city’s history of deindustrialization left a landscape of poverty and blight that still fuels crime today. While downtown revitalizes, many neighborhoods contend with “blight violence” in abandoned properties and persistent street-level crime. The city’s vast area relative to its population makes comprehensive policing a significant challenge.
4. Seattle, Washington
-
Total Crime Rate: 5,782.7 per 100,000
Similar to Portland, Seattle’s tech-boom prosperity exists alongside a severe property crime problem. The downtown core and certain neighborhoods struggle with high rates of car break-ins, retail theft, and vandalism, often linked to the city’s homelessness and substance abuse crises. For anyone querying “Is Seattle safe?”, the answer is nuanced: while violent crime is relatively low, the risk to property is significant and highly visible.

5. Baltimore, Maryland
-
Total Crime Rate: 5,763.2 per 100,000
Baltimore’s crime is concentrated and intense. Driven by open-air drug markets and gang territorial disputes, the city suffers from one of the nation’s highest violent crime rates. A deep-seated mistrust between residents and law enforcement, stemming from decades of controversy, hampers crime-solving and prevention. This creates a cycle of violence that revitalization efforts have struggled to break in certain neighborhoods.

6. Denver, Colorado
-
Total Crime Rate: 5,754.6 per 100,000
Denver’s inclusion highlights the crime challenges that can accompany rapid growth. An influx of new residents has exacerbated income inequality and a housing affordability crisis, leading to increases in both property and violent crime. The city has seen a sharp rise in auto theft and crimes connected to methamphetamine and fentanyl use, signaling growing pains for the Mile-High City.

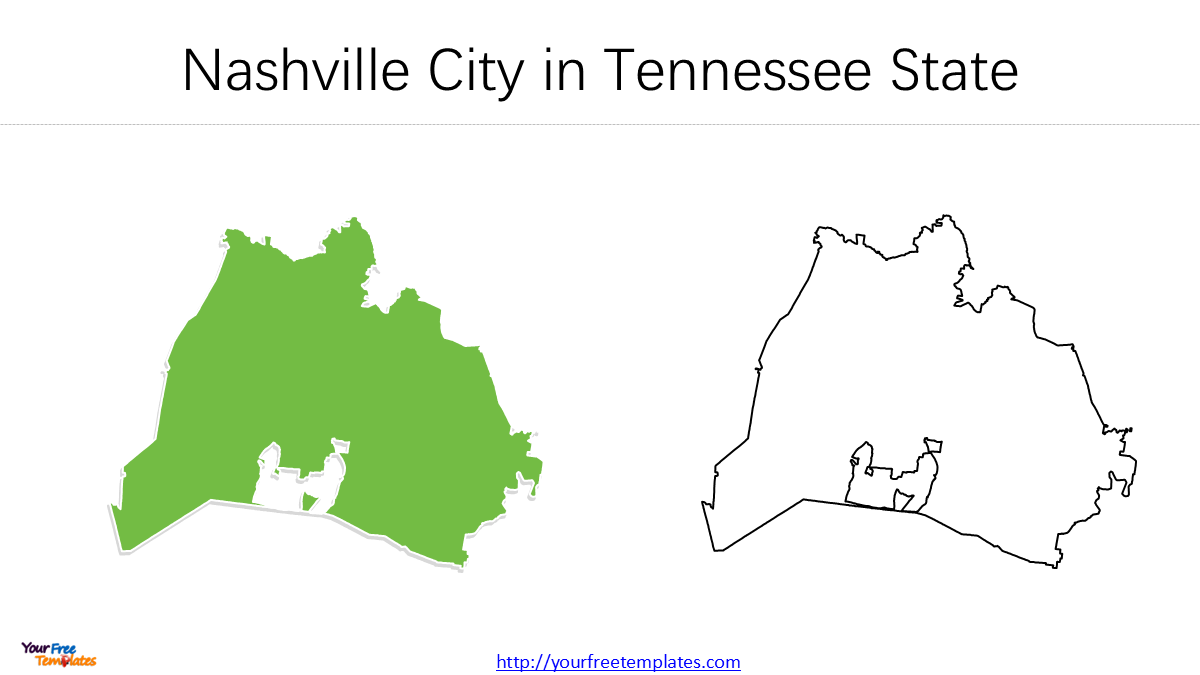
7. Nashville, Tennessee
-
Total Crime Rate: 5,633.6 per 100,000
Nashville’s “boomtown” status comes with a downside. The rapid population growth and thriving tourism industry have strained city resources and created opportunities for crime. The city sees a high rate of property crimes targeting tourists and residents alike, alongside rising violent crime in areas struggling with gentrification and displacement. When people check “crime statistics by city,” Nashville’s data reveals the flip side of its rapid success.
8. Philadelphia, Pennsylvania
-
Total Crime Rate: 5,456.9 per 100,000
Philadelphia grapples with chronic issues of poverty and concentrated disadvantage. The city’s crime is characterized by persistent gun violence and property crime, particularly in neighborhoods that have seen little of the economic investment enjoyed by the city center. Efforts to combat crime are ongoing, but systemic challenges make progress difficult.

9. Houston, Texas
-
Total Crime Rate: 5,441.6 per 100,000
As the nation’s fourth-largest city, Houston’s crime statistics reflect its massive scale and diversity. Its role as a major hub for human and drug trafficking influences its violent crime rates, while its sprawling geography makes consistent policing a challenge. Crime is often hyper-local, with significant variation between neighborhoods, which is crucial context for anyone analyzing “total crime rate by city” for a metro of this size.

10. San Antonio, Texas
-
Total Crime Rate: 5,217.8 per 100,000
San Antonio rounds out the list, facing challenges similar to other growing Sun Belt cities. It contends with property crimes linked to its tourism economy and transit corridors, as well as violent crime concentrated in specific, economically disadvantaged areas. The city’s balance between rich cultural history and modern urban growth presents unique public safety hurdles.

Conclusion: Understanding the Data on America’s Most Dangerous Cities
This list of the most dangerous cities in the U.S., ranked by total crime rate by city, provides a valuable snapshot, but it’s not the full story. Crime is rarely evenly distributed; safe and high-crime neighborhoods often exist within the same city limits.
Use this data as a starting point. When you search “crime statistics by city,” dig deeper into specific neighborhoods and local news. And when you wonder, “Is [City Name] safe?” remember that awareness and context are your best tools for making informed decisions, whether you’re planning a trip, considering a move, or simply staying informed about urban America.
Looking for Premium maps, please visit our affiliate site: https://editablemaps.com/ or https://ofomaps.com/
Size:554K
Type: PPTX
Most dangerous cities in the US Template
Click the link to download it.
Aspect Ratio: Widescreen 16:9
Click the green button to download it.
Download the 16:9 Template