

Introduction
Santa Clara County, California—home to Silicon Valley—is often described as one of the highest-income regions in the United States. But how does that reputation hold up when you look at Santa Clara County income by census tract rather than at the county average?
This analysis classifies all 408 census tracts in Santa Clara County into five median household income categories using 2024 inflation-adjusted dollars. The result is a tract-level income profile that reveals where high-income, middle-income, and low-income neighborhoods are concentrated—and what that means for planners, researchers, policymakers, and anyone interested in spatial inequality in the region.
This post summarizes the key findings and accompanies a three-slide PowerPoint template that visualizes Santa Clara County median household income by census tract geographically and statistically.
 Data Overview
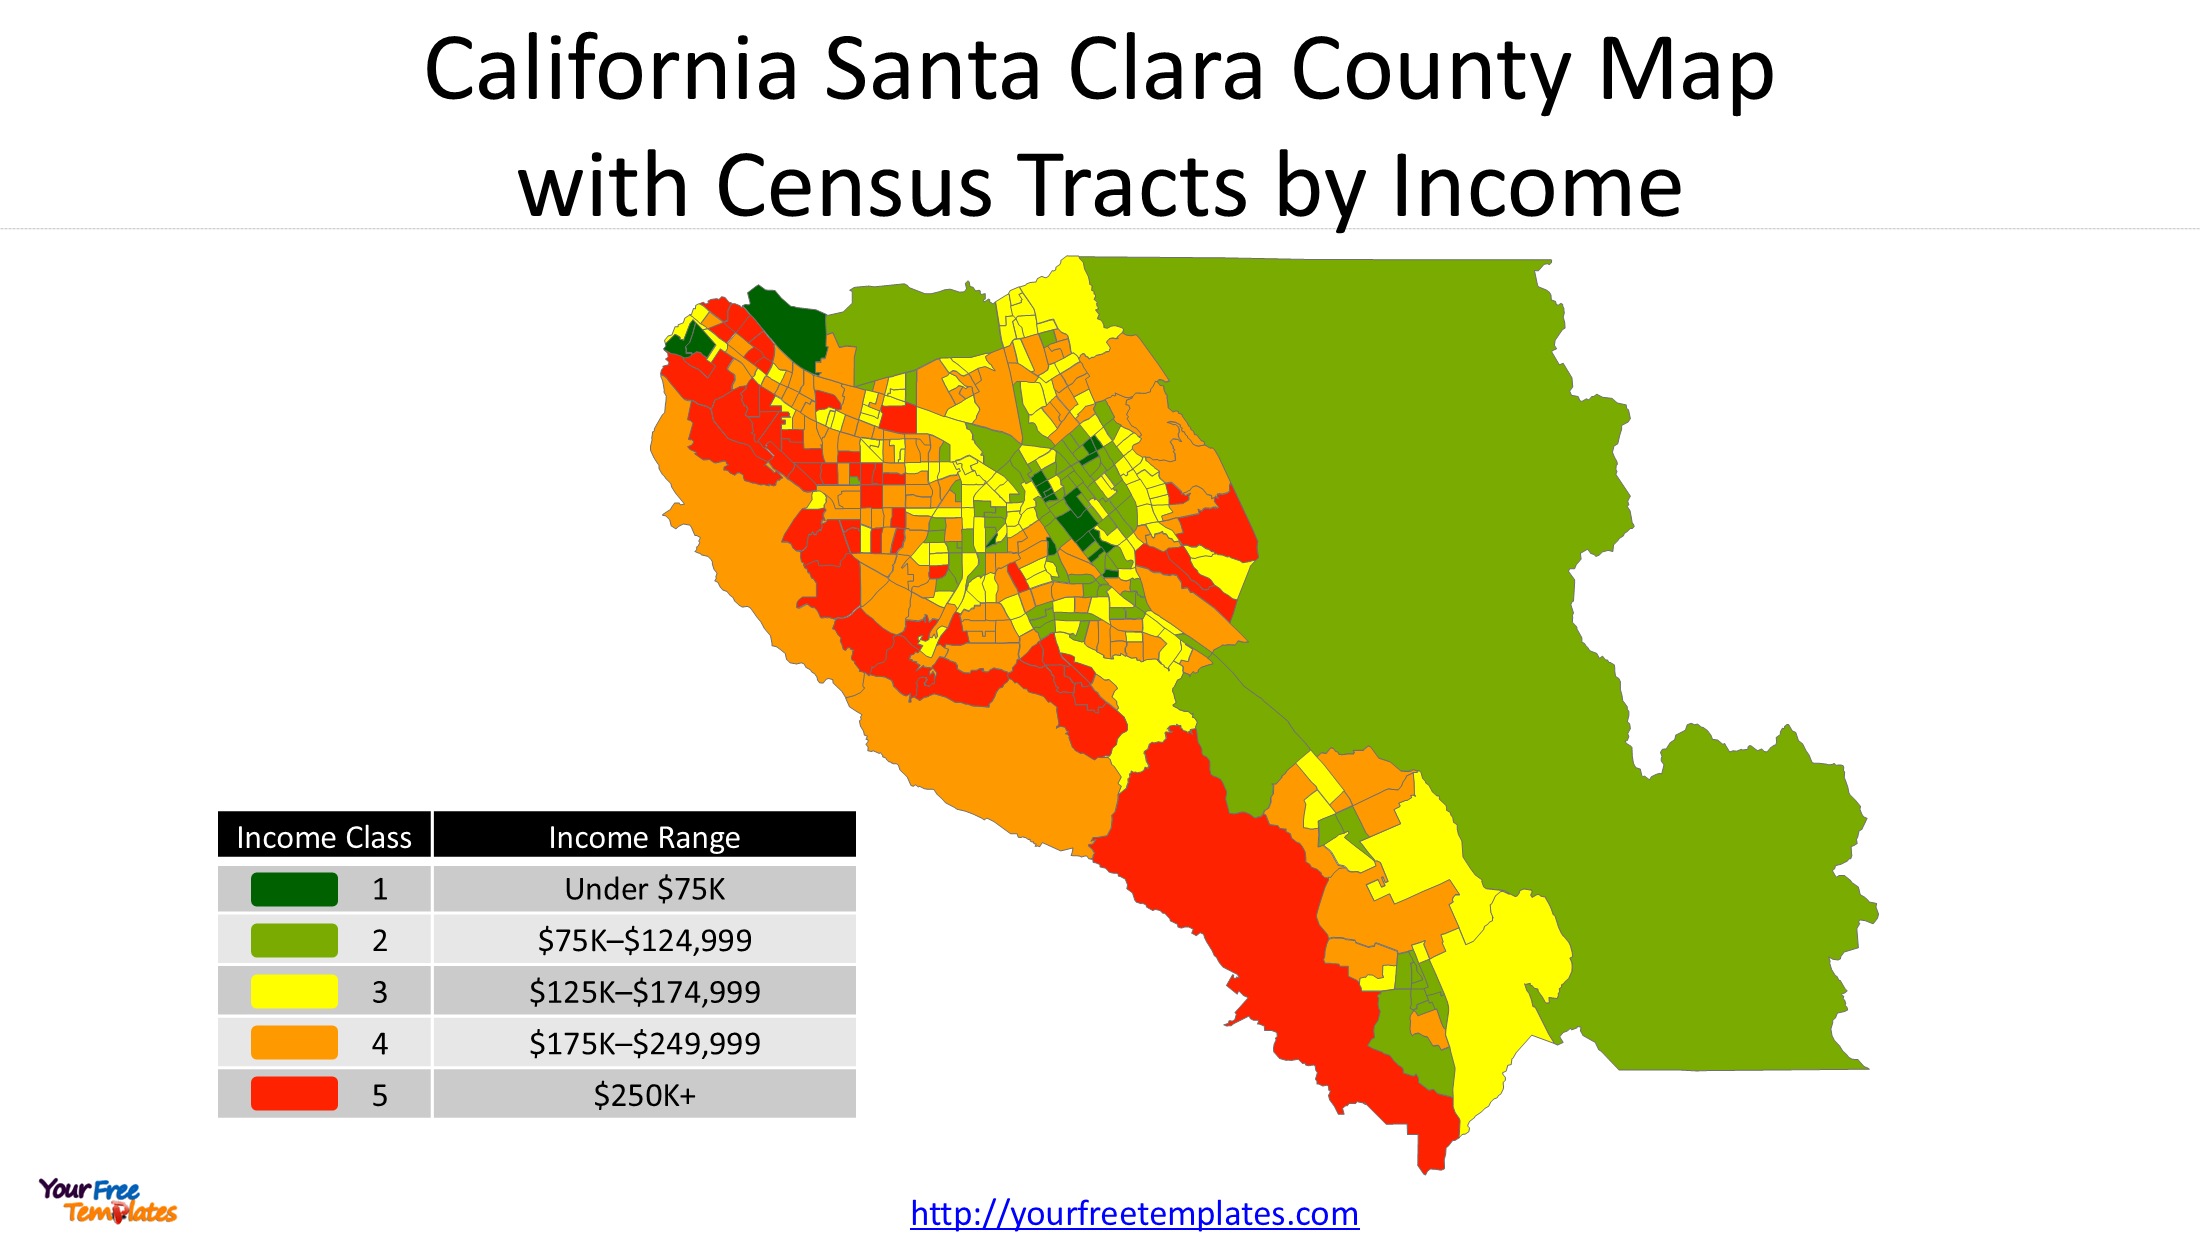
The analysis uses Santa Clara County income by census tract from the U.S. Census Bureau’s American Community Survey. Each census tract’s median household income (past 12 months, 2024 inflation-adjusted dollars) was assigned to one of five income classes:
| Income Class | Income Range |
|---|---|
| 1 | Under $75K |
| 2 | $75K–$124,999 |
| 3 | $125K–$174,999 |
| 4 | $175K–$249,999 |
| 5 | $250K+ |
Tracts with a median income of exactly $250,000 or more are top-coded at class 5.
Key Findings: Santa Clara County Tract-Level Income Profile
| Income Class | Income Range | No. of Tracts | % of Tracts |
|---|---|---|---|
| 1 | Under $75K | 18 | 4.4% |
| 2 | $75K–$124,999 | 88 | 21.6% |
| 3 | $125K–$174,999 | 119 | 29.2% |
| 4 | $175K–$249,999 | 127 | 31.1% |
| 5 | $250K+ | 56 | 13.7% |
| Total | 408 | 100.0% |
 1. The county is dominated by upper-middle and high-income tracts
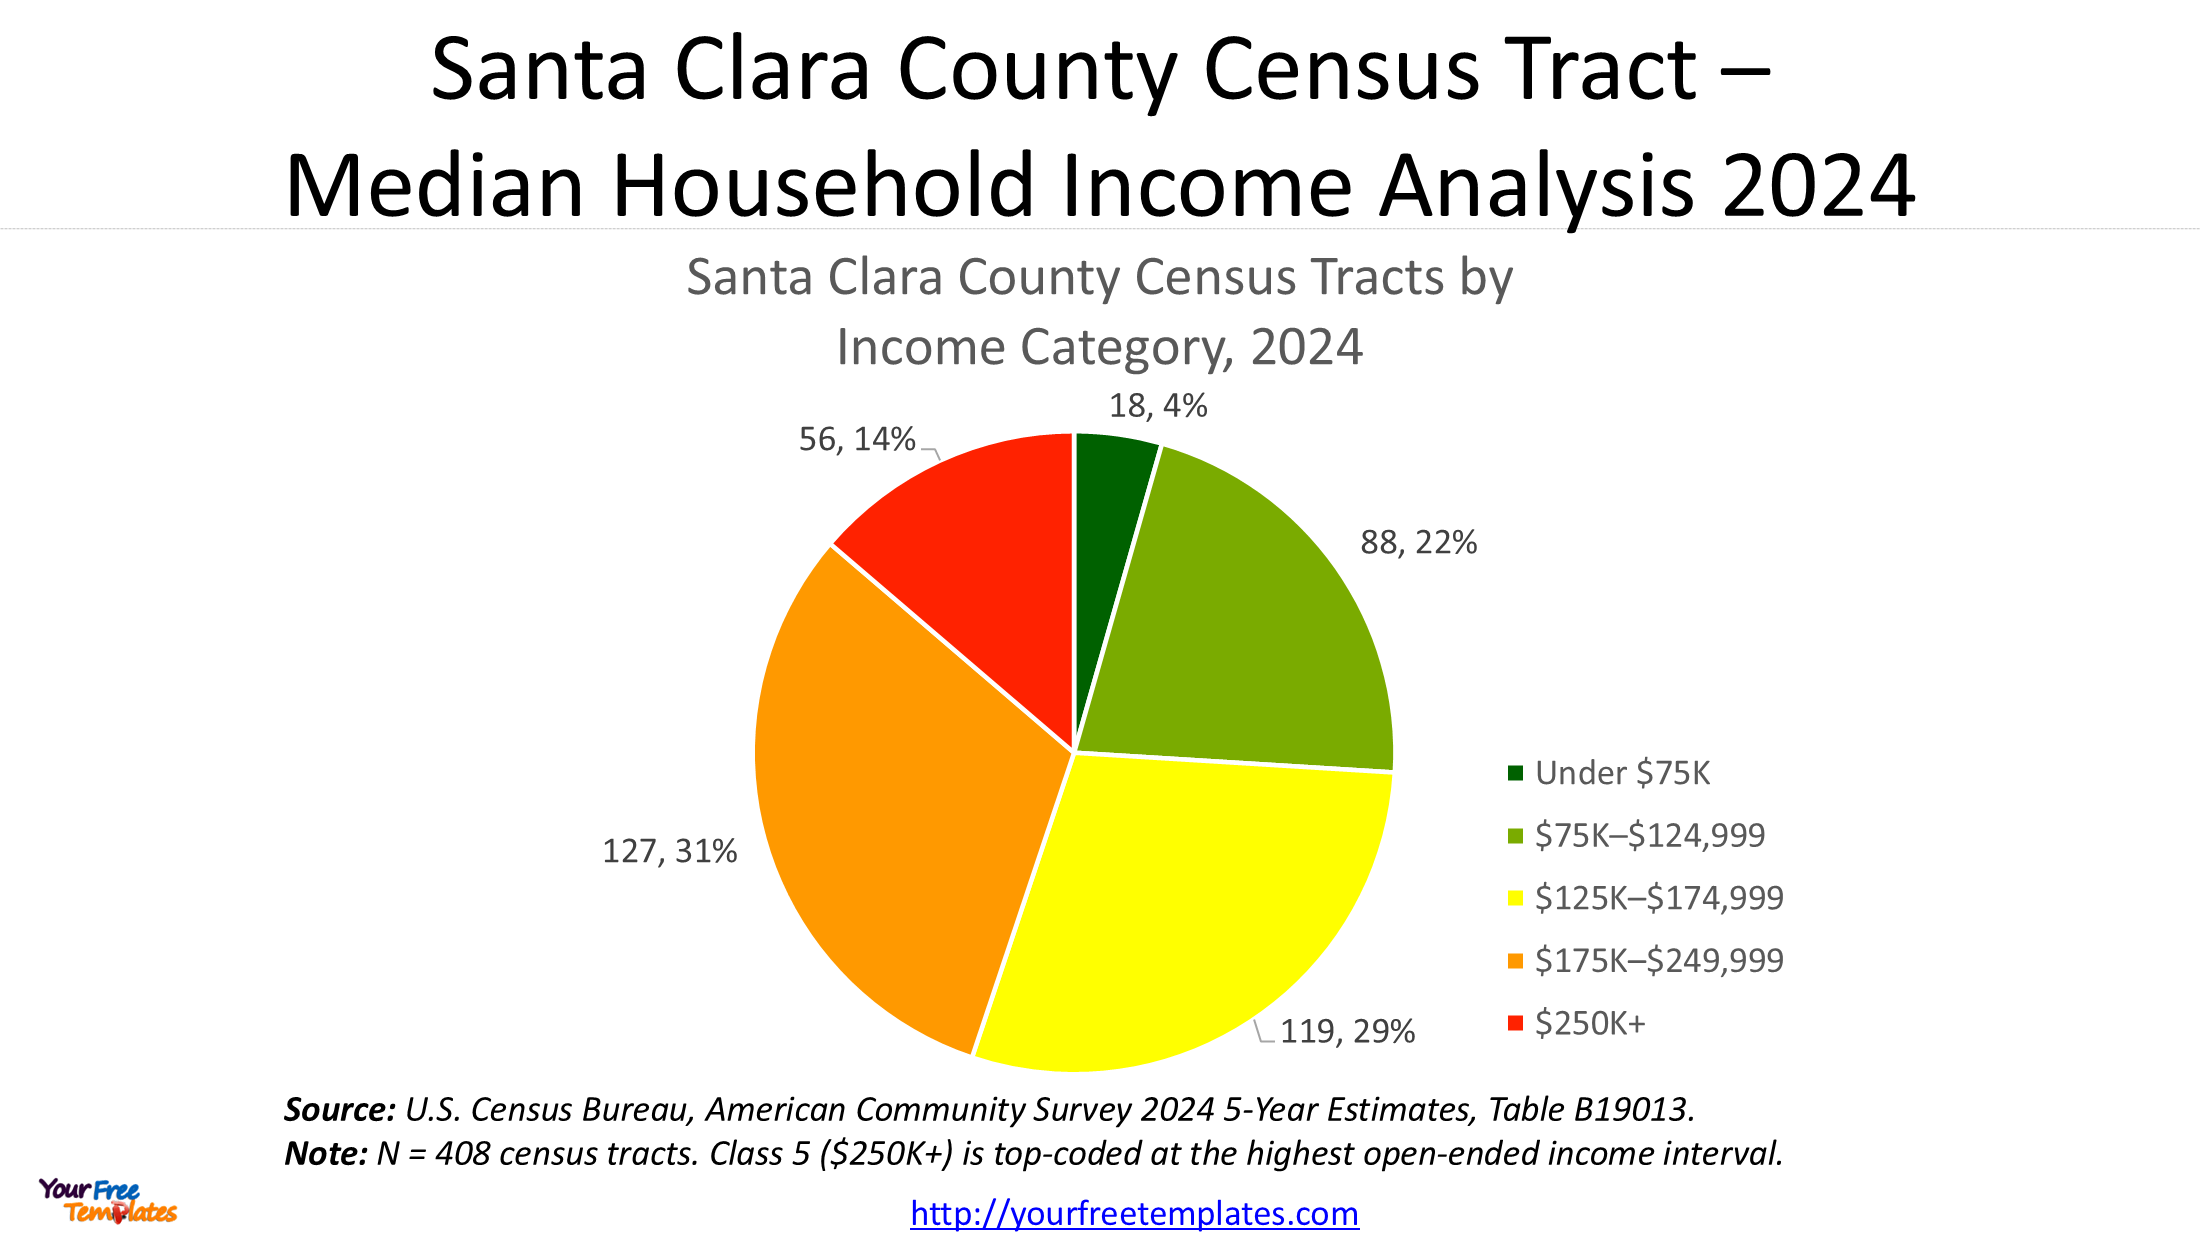
Nearly 45% of all tracts (183 tracts) fall into class 4 or 5—median household incomes of $175,000 or more**. The single largest category is **class 4 ($175K–$249,999), containing 127 tracts, or 31.1% of the county.
2. Top-coded $250K+ tracts are a significant minority
56 tracts (13.7%) report a median household income of **$250,000 or more**—the top-coded ceiling. These tracts are concentrated in the highest-cost, highest-income neighborhoods of the county. Because the data are top-coded, the true incomes in these tracts may be considerably higher than $250,000.
3. Low-income tracts are relatively rare—but not absent
Only 18 tracts (4.4%) have a median household income under $75,000**. Just over a quarter of tracts (**26.0%**) fall below **$125,000 (classes 1–2). By comparison, high-income tracts (classes 4–5) outnumber low-income tracts (class 1) by roughly 10 to 1.
4. Middle-income tracts remain substantial
Classes 2 and 3 ($75K–$174,999) together account for 207 tracts, or 50.8% of the county. So while Santa Clara County is strongly associated with extreme wealth, more than half of its census tracts remain in the middle-income band—a finding that complicates the “all-Silicon-Valley-is-rich” narrative.
5. The tract-weighted median category is class 3
Ranking the 408 tracts by income class, the midpoint falls within class 3 ($125K–$174,999). This is a useful summary benchmark: the “typical” Santa Clara County tract is upper-middle income, not top income.
6. Distribution at a glance
-
Class 1: 4.4%
-
Class 2: 21.6%
-
Class 3: 29.2%
-
Class 4: 31.1%
-
Class 5: 13.7%
The distribution is right-skewed—weighted toward the upper categories—with a long, thin low-income tail and a substantial top-coded block.
Data Source: Why ACS 2024 5-Year B19013 Matters
The figures above come from U.S. Census Bureau, American Community Survey 2024 5-Year Estimates, Table B19013: “Median Household Income in the Past 12 Months (in 2024 Inflation-Adjusted Dollars).” The Estimate column is B19013_001E; the Margin of Error column is B19013_001M.
The choice of this source carries real analytical weight for any Santa Clara County census tract income study:
-
Geographic fit. ACS 5-Year Estimates are the only official ACS product published at the census tract level. A 1-year estimate cannot support this analysis at all.
-
Median robustness. B19013 measures the midpoint of the income distribution, which resists distortion from extreme high- or low-income households. This is why middle-income tracts remain visibly substantial rather than being washed out by top-end wealth.
-
Inflation adjustment and pooled sample. All values are in 2024 dollars, and the 60-month pooled sample increases reliability for small areas.
-
Transparent uncertainty. Every estimate carries a 90% margin of error. In the Santa Clara County data, all class-5 tracts show
***in the MOE column—this is the standard ACS symbol meaning the median falls in the highest open-ended interval and no finite margin of error can be computed. It is not missing data. -
Clear scope. B19013 reports a median, not a full distribution. Within-tract inequality requires companion tables such as B19001 (household income distribution) and B19301 (per capita income).
Key caveat: tract medians cannot be averaged to produce a county median, and overlapping 5-year windows should not be compared directly.
Why This Analysis Matters: Information Gains
This tract-level classification offers several practical advantages over a single countywide average:
-
Reveals spatial inequality. A county median hides enormous variation between neighborhoods. Mapping Santa Clara County income by census tract shows where low-income and top-income areas cluster.
-
Supports targeting and resource allocation. Affordable-housing programs, social services, school funding, and public-health outreach can be directed toward class-1 and class-2 tracts.
-
Enables equity and service-gap analysis. Comparing income-class geography against transit, parks, healthcare, and food-access maps can surface underserved areas.
-
Provides a benchmark for subregional comparison. The county’s profile can be compared with neighboring San Mateo County or with state and national tract distributions.
-
Informs housing and land-use policy. Knowing the share of top-coded tracts helps frame discussions about housing affordability, inclusionary zoning, and displacement risk.
-
Communicates complex data simply. A five-class scheme is intuitive for public audiences, maps, and dashboards while retaining analytical rigor.
Important Limitations
-
Tract-level, not household-level. This is the distribution of tract median incomes, not of households. A tract with 1,000 households counts the same as a tract with 10,000.
-
Unweighted by population. To describe how residents are distributed across income classes, population or household weights would be required.
-
**Top-coding at $250K+.** Class 5 hides all variation above $250,000.
-
Margins of error. ACS estimates carry margins of error; tracts near class boundaries may be misclassified.
-
Within-tract inequality is invisible. A tract with a median of $150K may still contain substantial poverty and wealth.
-
Tracts with no data. Any tract lacking a median-income estimate should be excluded from class percentages and flagged in mapping.
Companion PowerPoint: Three Slides
The accompanying deck visualizes the analysis in four slides:
-
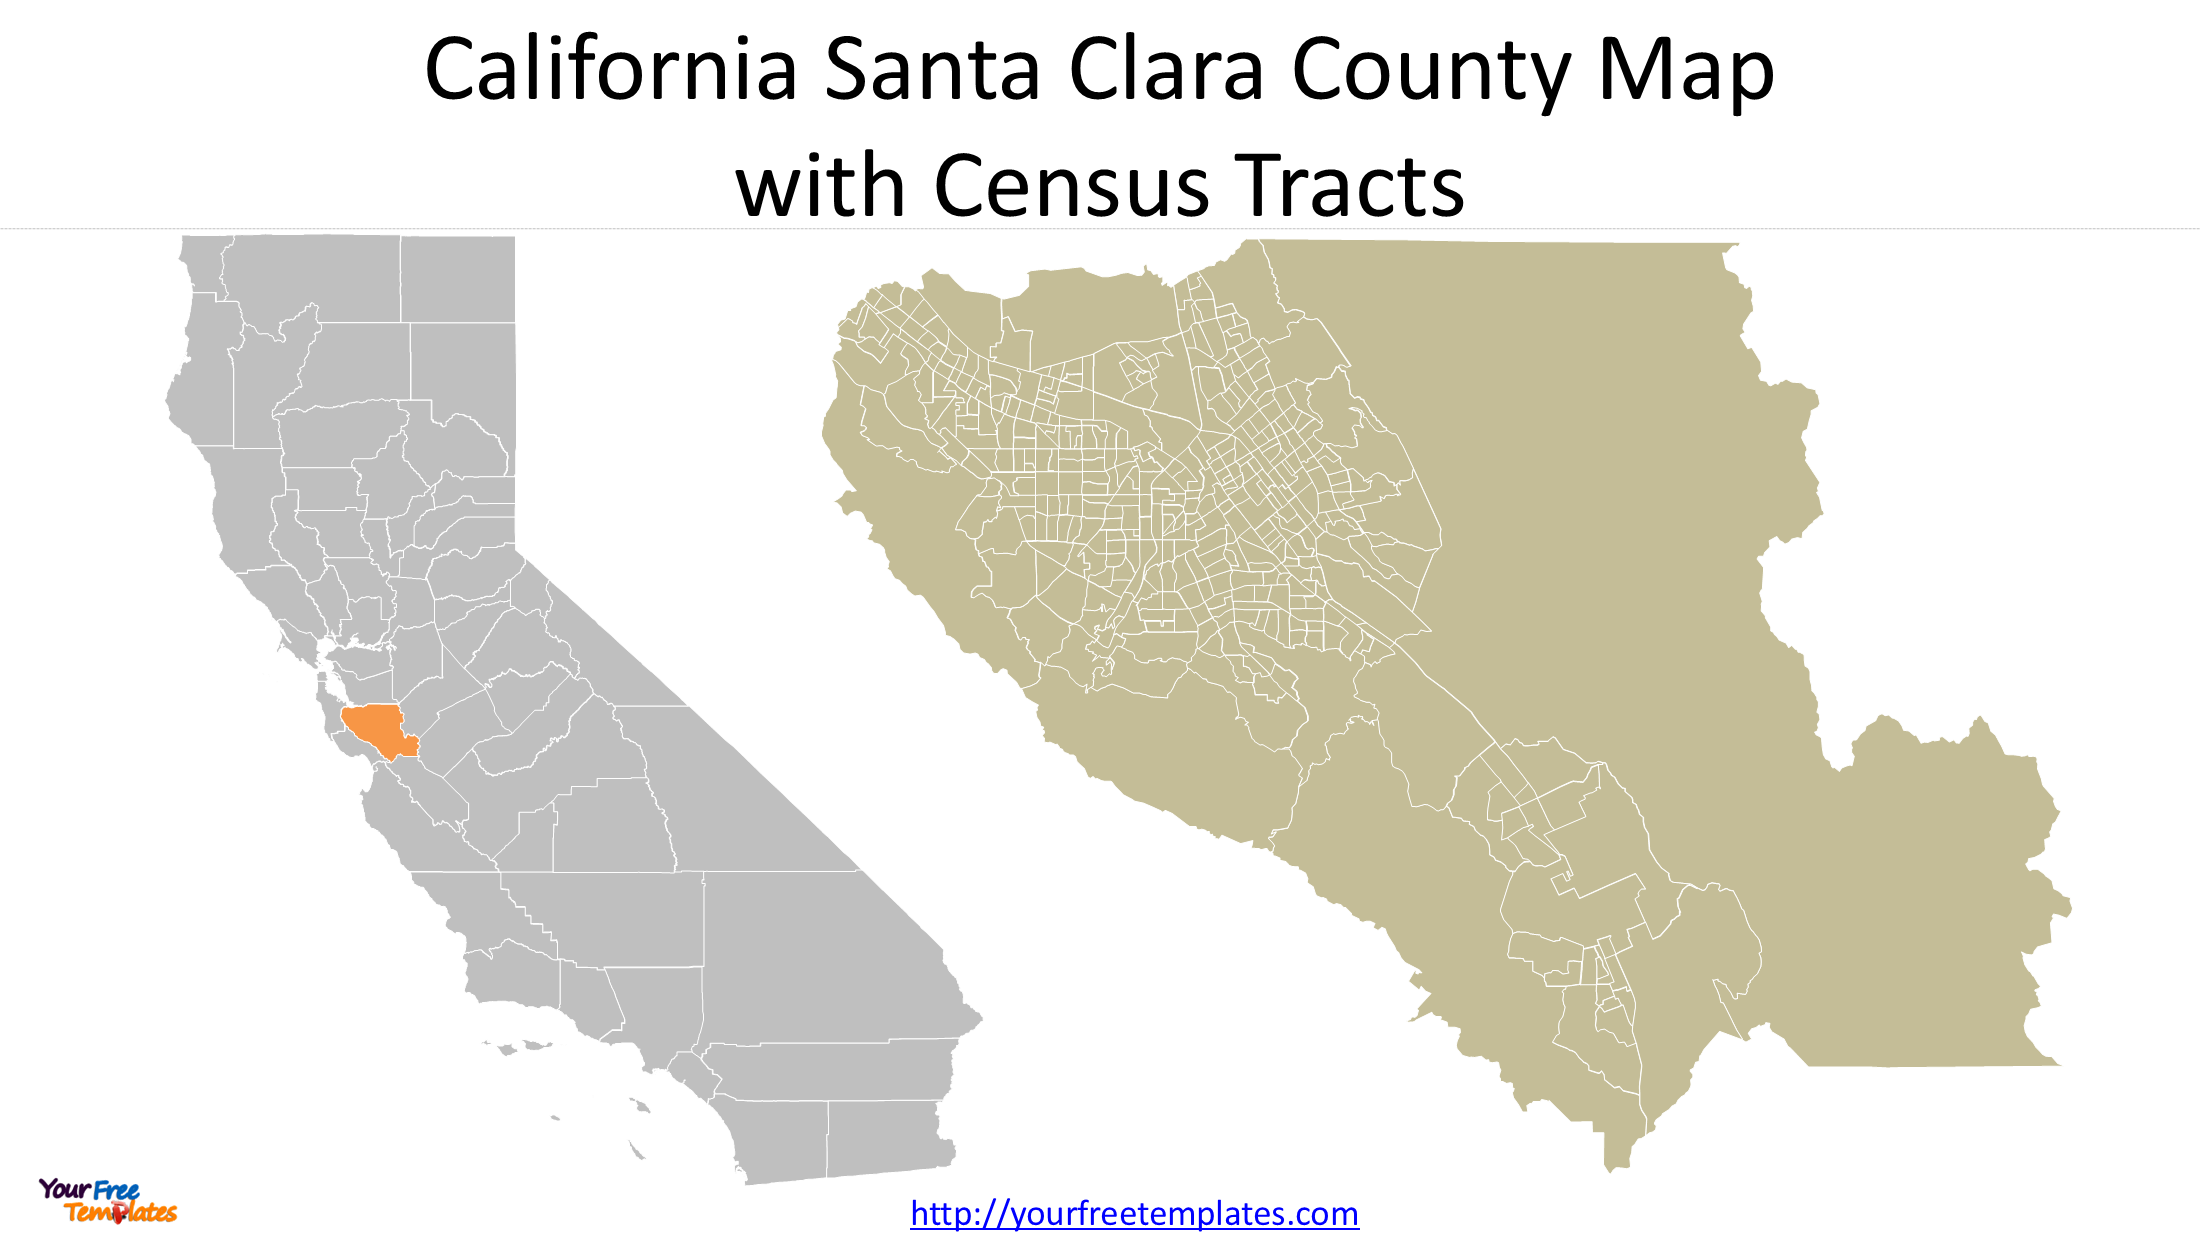
Location of Santa Clara County — a U.S. map highlighting California and Santa Clara County, establishing geographic context. Blank Santa Clara County tract map (2024) — the county boundary with all 2024 census tract boundaries, providing a reference base map.
-
Choropleth map by income category — Santa Clara County census tract income shaded in five colors corresponding to classes 1–5, with a legend and class labels.
-
Pie chart of tract shares — the percentage of tracts in each of the five income categories (4.4%, 21.6%, 29.2%, 31.1%, 13.7%), summarizing the distribution at a glance.
Together, the slides move from where the county is, to what its tract geography looks like, to how income is spatially distributed, to how much of the county falls into each class.
Conclusion
Santa Clara County median household income by census tract presents a profile that is high-income overall but far from uniform. With 44.8% of tracts at $175K+**, **13.7% top-coded at $250K+, and only 4.4% below $75K, the county displays a pronounced upper-income skew—yet more than half of its tracts remain in the middle-income band and a meaningful low-income tail persists.
For planners, researchers, and policymakers, this tract-level view of Santa Clara County income by census tract offers a more honest and actionable picture than a countywide average: it shows where income advantage and disadvantage are located, and it provides a foundation for equity analysis, resource targeting, and evidence-based local policy.
Looking for Premium maps, please visit our affiliate site: https://editablemaps.com/ or https://ofomaps.com/
Size:180K
Type: PPTX
Santa Clara County Median Household Income by Census Tract Template
Click the link to download it.
Aspect Ratio: Widescreen 16:9
Click the green button to download it.
Download the 16:9 Template