
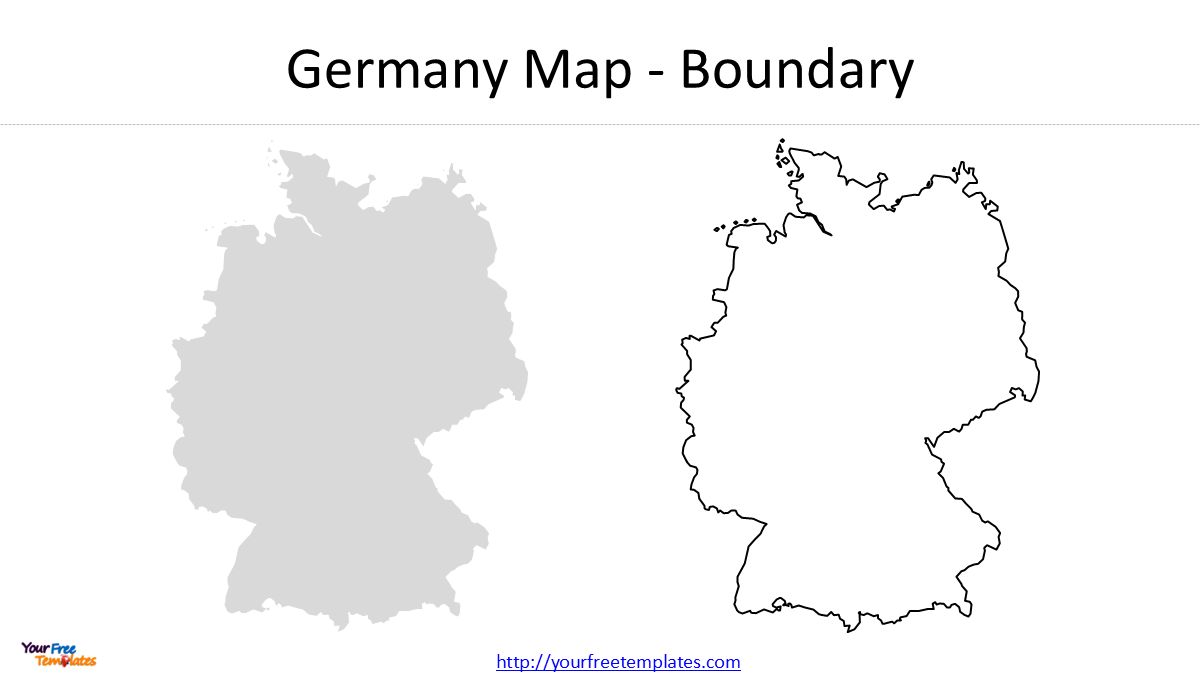
Germany NUTS maps are essential when preparing market analysis, presenting Eurostat statistics, or conducting regional economic research. While most audiences recognize Germany’s 16 federal states (NUTS 1), official EU datasets are frequently published at NUTS 2 and NUTS 3 levels for deeper regional insight. This complete guide explains the differences between Germany NUTS regions, helps you choose the right Germany NUTS map for your data, and provides fully editable PowerPoint map templates to streamline your reporting and dashboards.
What are NUTS Regions?
The NUTS classification is the European Union’s standardized geographic framework for collecting, publishing, and comparing regional statistics across member countries.
Instead of relying solely on national administrative boundaries, Eurostat organizes socioeconomic datasets using NUTS regions so that information from Germany can be compared consistently with France, Italy, Spain, Poland, and other EU countries.
If you work with:
- Eurostat datasets
- Regional GDP statistics
- Population analysis
- Innovation indicators
- EU Cohesion Policy
- Business intelligence
- Academic research
you will frequently encounter NUTS regions rather than traditional administrative boundaries.
Unlike Germany’s federal states or counties, NUTS regions are statistical classifications rather than separate levels of government.
Germany Administrative Divisions vs NUTS Levels
Many users are surprised that Germany’s administrative structure and NUTS regions are related—but not identical.
| Administrative Division | Statistical Equivalent | Typical Applications |
|---|---|---|
| Germany | Country | National reports |
| 16 Bundesländer (States) | NUTS 1 | State comparison, demographic analysis |
| Statistical Regions / Regierungsbezirke (where applicable) | NUTS 2 | Regional development, EU funding |
| Landkreise & Kreisfreie Städte | NUTS 3 | Detailed socioeconomic analysis |
| Municipalities (Gemeinden) | LAU | Local planning and administration |
One of the most common misconceptions is that NUTS creates additional administrative regions. In reality, it is simply a statistical framework used by the European Union.
Germany NUTS 1 Map (16 Regions)
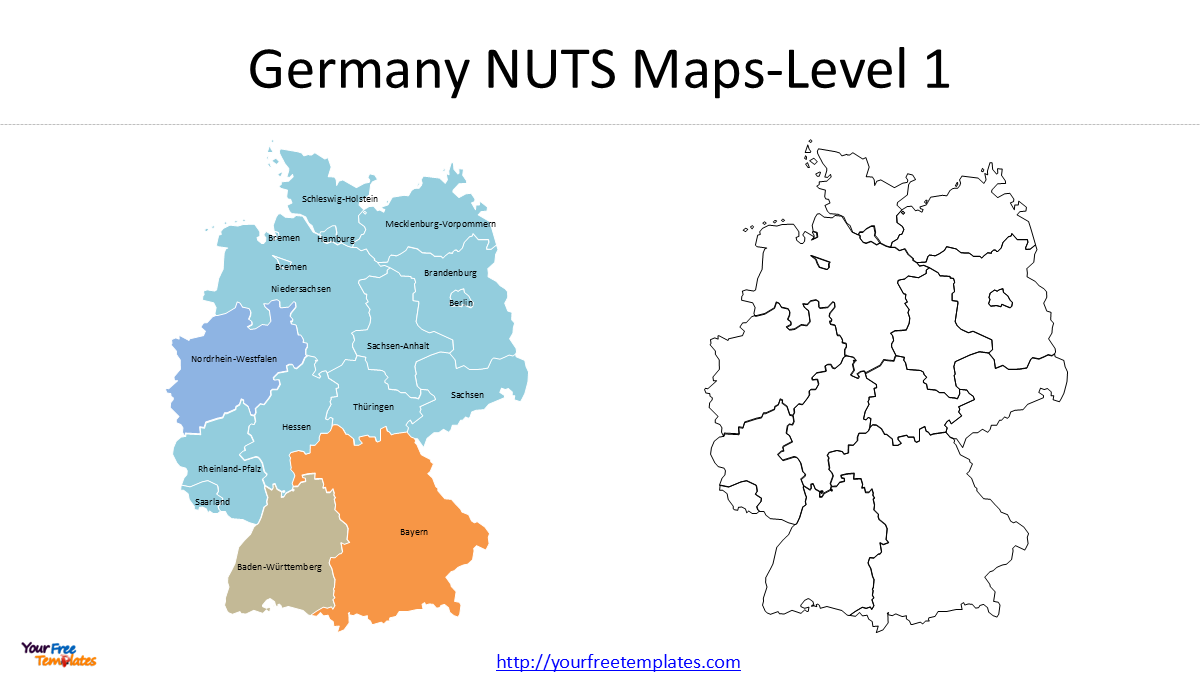
Our Germany NUTS 1 PowerPoint map contains all 16 federal states (Bundesländer).
Because NUTS 1 corresponds directly to Germany’s states, this level is the most familiar to international audiences.
Typical applications include:
- State population comparison
- GDP by state
- Tourism statistics
- Election visualization
- Sales territory presentations
- Regional business reports
The editable PowerPoint version allows every state to be individually colored, labeled, resized, or animated.
Germany NUTS 1 Code Lookup Table
| NUTS Code | States |
| DE1 | Baden-Württemberg |
| DE2 | Bayern |
| DE3 | Berlin |
| DE4 | Brandenburg |
| DE5 | Bremen |
| DE6 | Hamburg |
| DE7 | Hessen |
| DE8 | Mecklenburg-Vorpommern |
| DE9 | Niedersachsen |
| DEA | Nordrhein-Westfalen |
| DEB | Rheinland-Pfalz |
| DEC | Saarland |
| DED | Sachsen |
| DEE | Sachsen-Anhalt |
| DEF | Schleswig-Holstein |
| DEG | Thüringen |
Source: Territorial units for statistics (NUTS) – GISCO – Eurostat
Germany NUTS 2 Map (38 Regions)
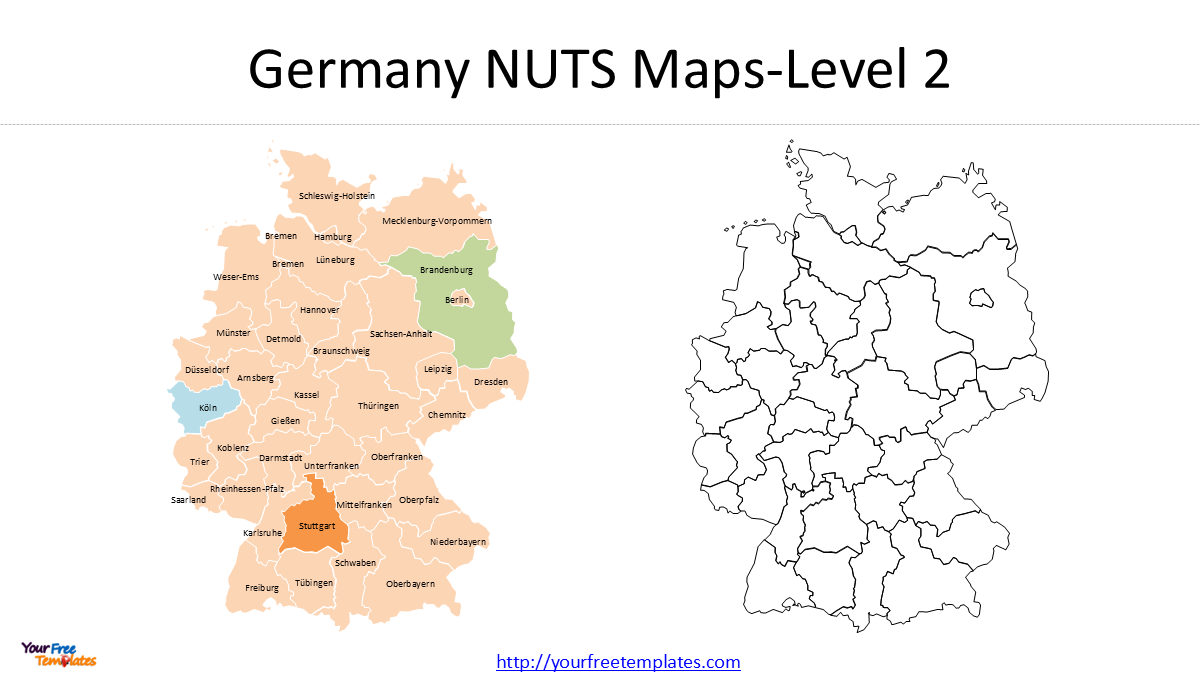
The Germany NUTS 2 template contains 38 statistical regions.
Unlike NUTS 1, larger federal states are subdivided into multiple statistical regions to provide more detailed regional analysis.
For example, Bavaria contains several NUTS 2 regions rather than appearing as a single unit.
NUTS 2 is one of the most widely used regional levels in European statistics because it balances geographic detail with manageable map complexity.
Common datasets available at NUTS 2 include:
- Regional GDP
- Employment
- Innovation performance
- Healthcare indicators
- Education statistics
- Environmental data
- EU Cohesion Policy funding
- Research and development expenditure
For consulting firms, investment reports, and regional benchmarking, NUTS 2 is often the preferred mapping level.
Germany NUTS 2 Code Lookup Table
| NUTS Code | NUTS 2 Region |
| DE11 | Stuttgart |
| DE12 | Karlsruhe |
| DE13 | Freiburg |
| DE14 | Tübingen |
| DE21 | Oberbayern |
| DE22 | Niederbayern |
| DE23 | Oberpfalz |
| DE24 | Oberfranken |
| DE25 | Mittelfranken |
| DE26 | Unterfranken |
| DE27 | Schwaben |
| DE30 | Berlin |
| DE40 | Brandenburg |
| DE50 | Bremen |
| DE60 | Hamburg |
| DE71 | Darmstadt |
| DE72 | Gießen |
| DE73 | Kassel |
| DE80 | Mecklenburg-Vorpommern |
| DE91 | Braunschweig |
| DE92 | Hannover |
| DE93 | Lüneburg |
| DE94 | Weser-Ems |
| DEA1 | Düsseldorf |
| DEA2 | Köln |
| DEA3 | Münster |
| DEA4 | Detmold |
| DEA5 | Arnsberg |
| DEB1 | Koblenz |
| DEB2 | Trier |
| DEB3 | Rheinhessen-Pfalz |
| DEC0 | Saarland |
| DED2 | Dresden |
| DED4 | Chemnitz |
| DED5 | Leipzig |
| DEE0 | Sachsen-Anhalt |
| DEF0 | Schleswig-Holstein |
| DEG0 | Thüringen |
Source: Territorial units for statistics (NUTS) – GISCO – Eurostat
Germany NUTS 3 Maps
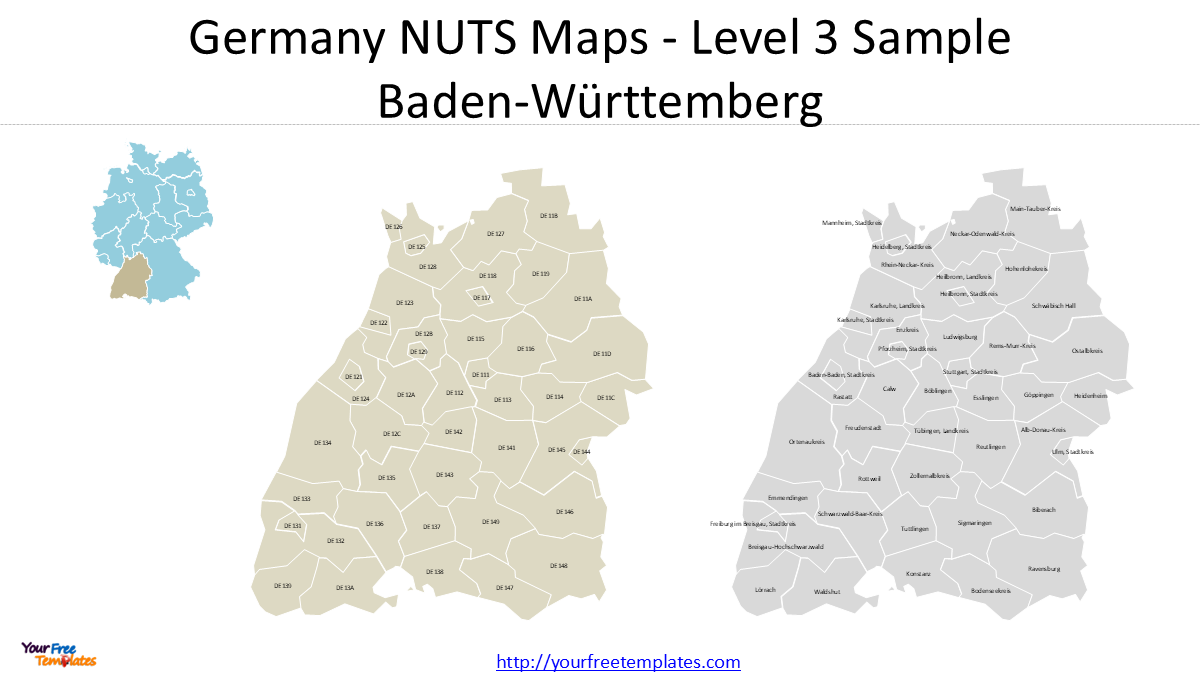
Germany contains over 400 NUTS 3 regions, making a nationwide PowerPoint map difficult to edit and present effectively.
Instead, this website provides sample NUTS 3 editable maps for several of Germany’s largest states, including:
- Baden-Württemberg
These examples demonstrate county-level statistical mapping while remaining practical for PowerPoint presentations.
Typical NUTS 3 applications include:
- County-level market analysis
- Healthcare accessibility
- Retail expansion planning
- Logistics optimization
- Employment analysis
- Population density studies
Which NUTS Level Should You Use?
Choosing the appropriate geographic level depends on your project.
| Objective | Recommended Level |
|---|---|
| National overview | Germany |
| Compare federal states | NUTS 1 |
| Compare regional economies | NUTS 2 |
| County-level statistics | NUTS 3 |
| Local planning | Municipality (LAU) |
If your data comes from Eurostat, NUTS 2 is often the most useful balance between readability and regional detail.
Common Eurostat Datasets by NUTS Level
Many users download a map before realizing that their data is published at a different statistical level.
The following examples can help you choose the correct template.
| Dataset | Typical Geographic Level |
|---|---|
| Population | NUTS 1, NUTS 2, NUTS 3 |
| GDP | NUTS 2 |
| Unemployment | NUTS 2 |
| Household income | NUTS 2 |
| Research & Development | NUTS 2 |
| Innovation | NUTS 2 |
| Agriculture | NUTS 2 / NUTS 3 |
| Life expectancy | NUTS 2 |
| Transport accessibility | NUTS 2 / NUTS 3 |
Selecting the appropriate template ensures your visualization matches the published dataset.
Business Applications of Germany NUTS Maps
Germany NUTS maps are widely used across multiple industries.
Consulting
Benchmark regional performance, market potential, and investment opportunities.
Finance
Visualize regional GDP, employment, and economic indicators.
Here you can use our Germany NUTS 2 Map to show GDP (gross domestic product) by NUTS 2 Regions.
- You can export Germany NUTS 2 regional GDP data 2024 (Million €) from Database – Eurostat
- Use business-friendly rounded ranges to classify the 38 regions into five groups as below.
GDP (Million €) Category Interpretation > 250,000 Very High Germany’s leading economic engines 150,000 – 250,000 High Major metropolitan economies 90,000 – 150,000 Upper-Middle Strong diversified regional economies 60,000 – 90,000 Middle Stable regional economies < 60,000 Lower Smaller or less densely populated regional economies - Download our Germany NUTS 2 Map and select the appropriate color in the pallet to present different group.
- Color each region by GDP group
- Call-out to highlight the very high roup of four regions.
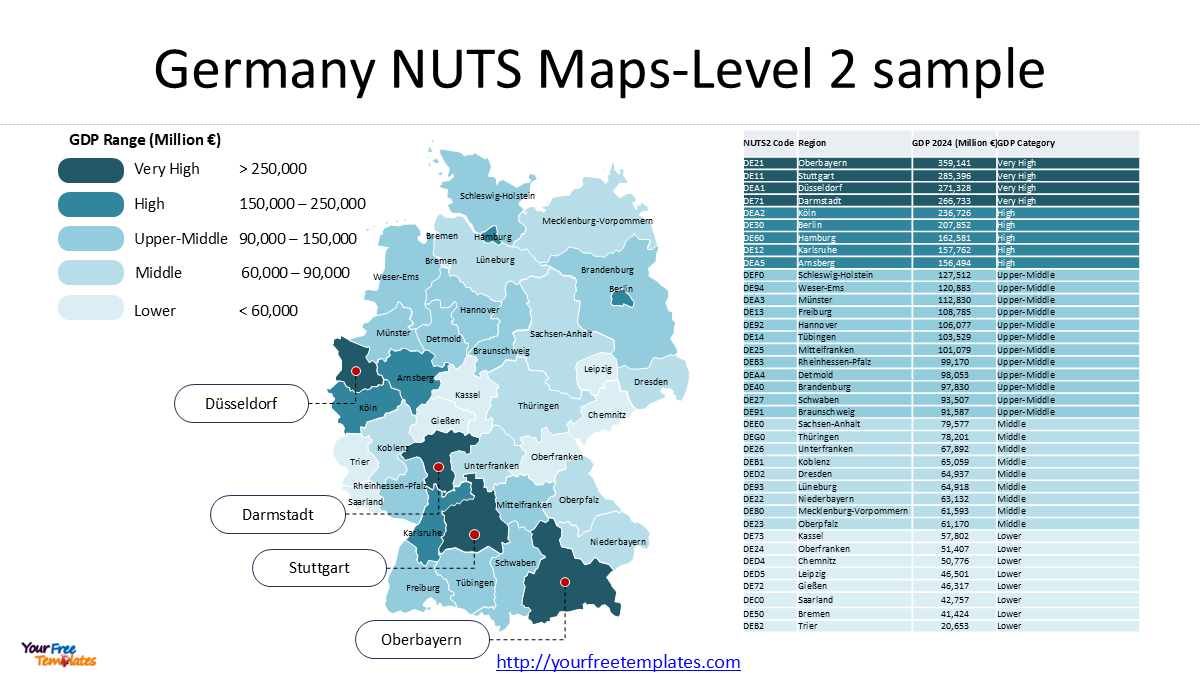
The regions are grouped into five GDP categories based on total regional gross domestic product (million euros). The classification uses rounded value ranges to make comparisons easier in presentations. Regions in the “Very High” category are major metropolitan economic hubs, while lower categories often reflect smaller populations or geographic size rather than lower productivity.
Healthcare
Present disease prevalence, hospital accessibility, or demographic trends.
Logistics
Map warehouse locations, delivery networks, and transportation corridors.
Retail
Analyze customer distribution and expansion opportunities.
Universities and Research
Visualize statistical indicators published by Eurostat and German federal agencies.
Why NUTS Regions Don’t Always Match Administrative Boundaries
Another common source of confusion is that NUTS regions do not always align perfectly with Germany’s administrative geography.
This happens because:
- NUTS is designed for statistical comparability across Europe.
- Administrative reforms and statistical revisions occur on different schedules.
- Some federal states are subdivided into multiple statistical regions to maintain consistent population sizes.
- Eurostat periodically updates NUTS classifications as demographics and administrative structures evolve.
Understanding this distinction helps prevent mismatches between statistical datasets and administrative maps.
NUTS vs Landkreis vs Regierungsbezirk
| Geographic Unit | Administrative Level | Statistical Level | Best Use |
|---|---|---|---|
| Bundesland | Yes | Yes | State reports |
| Regierungsbezirk | Yes (selected states) | Often associated with NUTS 2 | Regional administration |
| Landkreis | Yes | Frequently associated with NUTS 3 | Local analysis |
| NUTS 1 | No | Yes | State comparison |
| NUTS 2 | No | Yes | Regional economic analysis |
| NUTS 3 | No | Yes | Detailed socioeconomic mapping |
Understanding these differences makes it much easier to select the correct map for your report.
Download Germany NUTS PowerPoint Maps
Our editable vector templates include:
- Germany NUTS 1 PowerPoint Map (16 federal states)
- Germany NUTS 2 PowerPoint Map (38 statistical regions)
- Germany NUTS 3 Sample Maps for Baden-Württemberg
Each template is fully editable in Microsoft PowerPoint. Individual regions can be recolored, resized, grouped, labeled, or animated without requiring GIS software.
Looking for Premium maps, please visit our affiliate site: https://editablemaps.com/ or https://ofomaps.com/
Size:380K
Type: PPTX
Germany NUTS Maps (NUTS 1, 2 & 3) Template
Click the link to download it.
Aspect Ratio: Widescreen 16:9
Click the green button to download it.
Download the 16:9 Template
You may also be interested in our related Germany templates:
- Germany Map with 16 States
- Germany Cities Map
- Highest GDP per Capita German Districts Map
- Individual state maps for all 16 German federal states
Data Source and Map Specifications
The Germany NUTS PowerPoint templates are derived from the official GISCO (Geographic Information System of the Commission) datasets published by Eurostat. GISCO is the European Commission’s reference source for administrative and statistical boundaries used in Eurostat regional datasets, making it one of the most reliable sources for creating presentation maps that are compatible with European statistical data.
Dataset Source
- Data Provider: Eurostat GISCO
- Dataset: NUTS 2024 Geographic Data
- Coverage: NUTS Levels 1, 2 and 3
- Geometry: Region polygons (Multipolygon)
- Download Format: Shapefile, GeoJSON, TopoJSON, SVG and other GIS formats
- Official Download: Eurostat GISCO NUTS Download Portal
Map Specifications
| Item | Specification |
|---|---|
| Dataset Version | NUTS 2024 |
| Geometry Type | Region polygons (RG) |
| Map Scale | 1:10 Million (10M) |
| Coordinate Reference System | EPSG:3035 (ETRS89 / LAEA Europe) |
| Region Levels | NUTS 1, NUTS 2, NUTS 3 |
| Compatible Software | PowerPoint, Adobe Illustrator, ArcGIS, QGIS |
Why We Use the 1:10 Million Dataset
GISCO provides NUTS boundaries at several generalized map scales, including 1M, 3M, 10M, 20M and 60M, allowing users to choose the level of detail best suited to their application.
For our editable PowerPoint templates, we selected the 1:10 million (10M) dataset because it offers an excellent balance between visual quality and editing performance.
Advantages
- Lightweight vector file with a relatively small file size.
- Smooth and simplified boundaries that look clean in presentation slides.
- Faster editing and recoloring in Microsoft PowerPoint.
- Easier to animate and label individual regions.
- Ideal for business presentations, dashboards, reports, and infographics.
- Consistent appearance across different European countries when creating comparative maps.
Limitations
- Coastlines and administrative boundaries are generalized rather than highly detailed.
- Small geographic features such as narrow peninsulas, river bends, and coastal islands may be simplified or omitted.
- Not recommended for large-format printing or applications requiring highly accurate cartographic representation.
- Less suitable for detailed GIS analysis than the higher-resolution 1M or 3M datasets.
For most presentation and reporting purposes, the 10M dataset provides a cleaner and more readable appearance than highly detailed boundaries, especially when displayed on presentation slides or computer screens.
Why EPSG:3035?
The templates use EPSG:3035 (ETRS89 / Lambert Azimuthal Equal-Area Europe), the coordinate reference system recommended by the European Commission for pan-European statistical mapping. This projection minimizes area distortion across Europe, making it particularly suitable for visualizing regional indicators such as GDP, population, employment, and other Eurostat statistics.
If your project is intended for web mapping or online GIS platforms, GISCO also provides the same datasets in EPSG:3857 (Web Mercator) and EPSG:4326 (WGS 84). However, for statistical reports and PowerPoint presentations, EPSG:3035 remains the preferred choice because it preserves area relationships more effectively across the European continent.
Frequently Asked Questions
What does NUTS stand for?
NUTS stands for Nomenclature of Territorial Units for Statistics, the European Union’s standardized regional classification system.
Is NUTS the same as Germany’s administrative divisions?
No. Germany’s administrative divisions are governmental units, while NUTS regions are statistical classifications used primarily by Eurostat.
Which NUTS level is best for business presentations?
NUTS 2 is often the preferred choice because it provides regional detail without becoming overly complex.
Can I edit the PowerPoint maps?
Yes. Every region is an editable vector shape that can be recolored, resized, grouped, labeled, or animated directly in Microsoft PowerPoint.
Do I need GIS software?
No. All templates are designed specifically for PowerPoint users and require no GIS experience.
Final Thoughts
Whether you’re analyzing regional economies, visualizing Eurostat data, preparing consulting reports, or designing professional presentations, choosing the correct NUTS level can make your maps more informative and easier to understand.
Our Germany NUTS map collection combines editable PowerPoint templates with practical guidance, helping you select the appropriate statistical geography for your project while saving hours of manual editing.