In this article, we will cover everything there is to know about maps. This article will help you discover the world, from discussing the maps of the world to how maps have changed over the years. Also immediate download outline of map of the world and continents of the world map PowerPoint template with the Link.
Discover the world – outline of map of the world and continents of the world map.
The outline of map of the world below is just for land, you can easily fill color, add text to suit different needs.
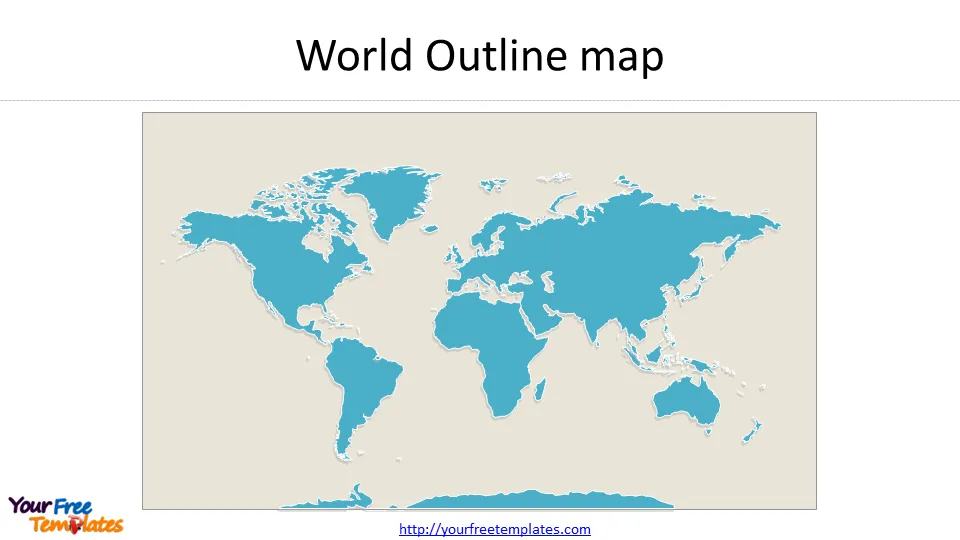
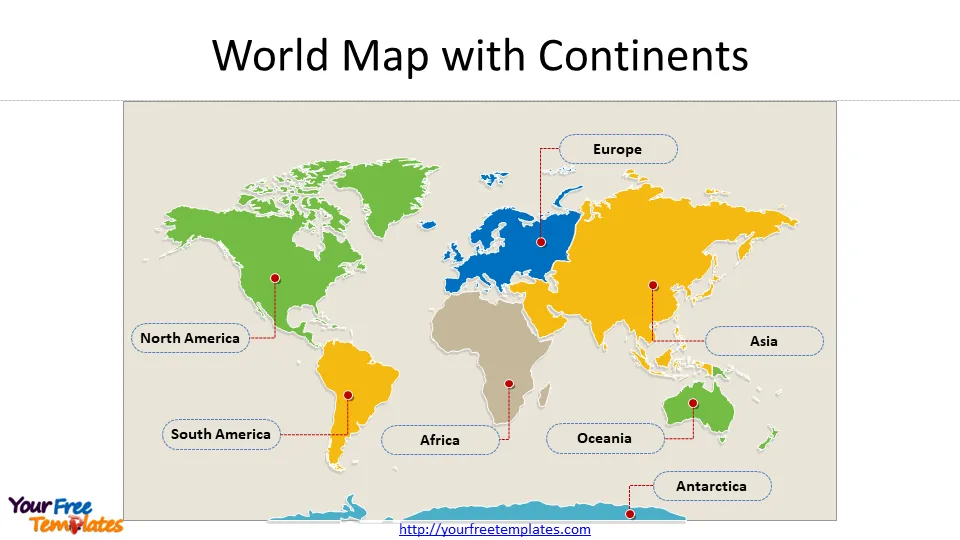
The seven continents in the world are Asia, Africa, North America, South America, Antarctica, Europe, and Oceania. You can directly download the Powerpoint outline of map of the world and continents of the world map by click the link here. Also Ocean templates for you to check are Pacific Ocean, Atlantic Ocean and Indian Ocean.
Discover the world -Advantages of Digital Maps
Most people look at maps as diagrams that help them navigate from one point in space to another. But maps are so much more than that. What a map gives you is beyond just the route from place X to Y.
Maps are the lens that gives you insight into the world around you, they are the doors to knowledge about the globe. Maps of the world will help you explore the place you call home, engage and interact with it, and in the end, gain a better understanding of it. They are critical pieces of information that help come up with solutions to issues facing the world.
And, let’s face it, maps are pretty cool too. There is nothing quite like taking a look at the place we live, zoomed out and removed. To be able to take in a larger snapshot of an area is pretty special.

https://pixabay.com/photos/earth-map-atlas-cartology-world-11048/
Digital maps are essentially data repositories that have expanded the horizons of what we can do with maps. New software and technology have made maps more interactive and informative.
Now you can do more than just look at a map and point out a country on it. You can visualize the world through a new lens.
This, coupled with databases of information, can give you insight into information on:
- Geography (regions, cities, countries, continents, borders, and territories)
- Topography (civilization, infrastructure, transport routes)
- Physical features of the planet (mountains, oceans, sea level and elevation, land and terrain, equator view, coasts, etc.)
- Statistical information and history (earth’s population, population by location, migration rates, etc.)
Basically, any sort of data and information can be presented on a map. Digital maps also help view real-time operations and changes on the planet. Mentioned below are a few links to digital maps by Your Free Templates.
Discover the world –How Maps Have Changed Over The Years
Maps have changed drastically over the years. They have become much more detailed and informative. The school of thought surrounding the creation of maps and the methods used to make them have also evolved. Cartography, which is the profession of mapping, has subsequently also seen many changes. With mapping technology evolving over the years, map production’s process and cost have largely simplified. But simultaneously, more intricate maps covering a wide array of regions and topics of interest are being made.
Maps nowadays can capture much more information about a specific region than they once did. With help of the latest technology and advancements in tech science, such as satellite imaging, the quality of maps produced has increased drastically. The satellite image captured can be converted into a map.
Gone are the days when all you could do with a map was locate a continent or country. These days, maps are considered sources of rich data that scientists in specific fields use as published citations. You can clearly see the contrast between a map from two decades ago and now. A map of the world links together visual perspective and information to present intuitive solutions to the world’s problems and manipulate data to extract findings.
Discover the world –What Information Can You Get from Maps?
The information you get from a map largely depends on its type and level of detail. Detailed maps provide finer insight into the information you seek and are slightly more complicated to interpret. Some maps integrate more than one aspect to present intersectional data about various topics. For instance, a political map combined with a topographic one can provide information about the political landscape, literally and figuratively, in particular regions. Maps are fairly easy to interpret, but the process of making maps has gone from a complicated one to an easier one.
Political Maps, Borders, And Territories
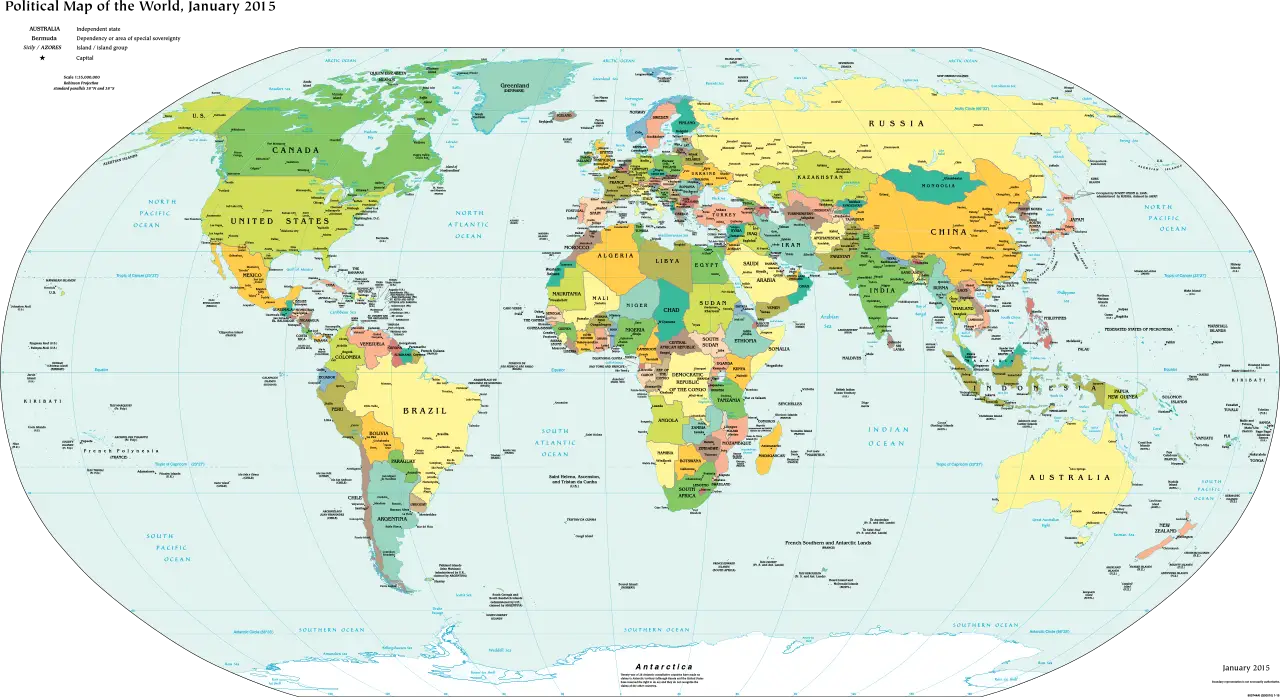
Political maps of the world depict not only the physical aspects of the world but political ones. A political map shows you the political separation of territories. In essence, different continents, countries, states, regions, and territories.
https://commons.wikimedia.org/wiki/File:Political_map_of_the_World_(January_2015).svg
A political map of the world will reference political separation on a global scale, while a country’s political map will represent the political features of that region and a few of its neighboring countries. The smaller the scale, the more detailed and informative the map will be. Maps of cities provide a detailed image of the city plan, infrastructure, transport routes, and major landmarks.
The place of manufacture influences how the countries are presented. For instance, many countries prefer not to indulge in information regarding territorial disputes. Labeling of regions is also a critical factor that is considered. For instance, maps represent countries such as China and North Korea with their political names (the Republic of China and the Democratic Republic of Korea).
Border disputes can also be interpreted from world political maps. If a particular region of a country isn’t shaded on or has a dashed border, it implies that a border or region issue is occurring there. For instance, a map made in India will depict Kashmir to be a part of it, whereas a map produced in Pakistan shows otherwise.
A political map also provides information on the capitals of countries and states. A detailed political map will even go as far as representing the capitals of districts, counties, and provinces. Alongside referencing governmental boundaries, borders, and features, a political map may also depict transport routes and certain geography that corresponds to drainage systems of mountains, lakes, etc.
An extension of political maps would be election and census maps that provide information about party politics, election results, and the demography of a country’s population. A political map isn’t very hard to interpret as long as you accurately reference the key or legend.
World Maps
World maps are a 2-dimensional representation of most, if not all, geographical surfaces of the Earth. World maps have the issue of projection since a three-dimensional structure is represented in a two-dimensional format. It is essentially an overhead view of the Earth and is thereby also called a flat map. A world map will give you a detailed depiction of all the countries and continents.
Time Zones
Time zone maps give you a presentation of the world’s different time zones. Traditional time zone maps simply provide an overview of time zones based on a longitudinal and latitudinal grid. Digital time zone maps, however, provide real-time information about the world’s time zones. Every time you refresh the website page, changes in the world clock are automatically taken into consideration, and the time is updated.
Physical Maps – Geography And Topography
https://commons.wikimedia.org/wiki/File:Large_World_Physical_Map.png
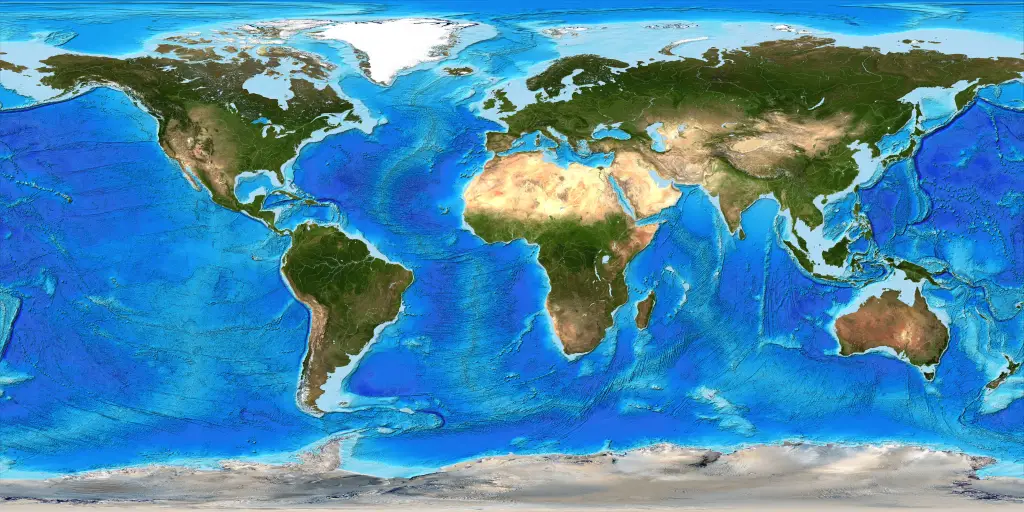
Physical maps are one of the more widely known maps and provide an overview of all of the geographical and topographical features of the Earth. They have identifiable natural features such as landscape features (mountains, plateaus, deserts, forests, etc.), water bodies (oceans, seas, lakes, rivers, and their basins, etc.), essential political borders, and other features such as the equator. In addition to highlighting geographical features, physical maps also provide information such as dimensions, height, depth, shape, etc., about the topography. A variation of the physical map would be a geopolitical map that combines both geography and political territories. In a physical map, different colors and shades are used to represent different gradient reliefs. Most maps use a green, brown, and blue color scheme. The green is for forests and pastures, brown for mountains and hilly terrains, and blue for water bodies. Dark green represents an increasing elevation near sea level. Drainage systems are shown in blue shading, while rivers and streams are in blue dotted lines. The darker the blue shade, the deeper the water body is.
Data Collection
Maps are a great source of data since they are not only repositories of information but also present that information in a way that is easy to read and interpret. Almost any type of data regarding the world can be presented on a map. Some of the most common information presented on maps include:
- Representation of socioeconomic factors across the world using parameters such as poverty levels by country or state, average income, GDP, etc.
- Representation of major and minor religions, ethnicities, races, cultures, and professions of different demographics in countries and continents across the globe.
- Information about literacy rates, life expectancy, disease control, gender disparity, wage gaps, infrastructure cost, country budgets, etc., can also be shown on maps.
- Distribution of agriculture, industry growth, energy consumption and production, frequency of natural disasters, climate change, sun exposure, changes in the landscape, and geography of the Earth is also presented on a map of the world.
Maps can also give insight into the history of places across the world. For instance, comparing two maps of a certain region will clearly show you changes in borders, indicating either geographical or political changes. In many countries, several territories have gone from being states to union territories to separate countries themselves. All of this information can easily be gained from a map. There are also maps of outer space that are visual representations of the solar system, galaxies, and beyond.
Pcl Map Collection
The Perry Castañeda library located at the University of Austin Texas is one of the largest archives of maps of the world. The Perry Castañeda library has a collection of over 250,00 maps, of which 20 percent are available to access online and download in pdf format. The PCL map Collection includes thematic, historical, topographic, oceanic, and world maps. Their “world map” collection includes maps of the following continents and regions: Asia, Africa, North and South America, Australia and the Pacific, Europe, Russia, the Middle East, and Antarctica. They also have a lot of maps dedicated to covering the state of Texas and North America. With consent, you can take images of the maps and cite them in publications.
Discover the world –Maps Of The World
Asia
https://commons.wikimedia.org/wiki/File:Map_of_Asia.svg
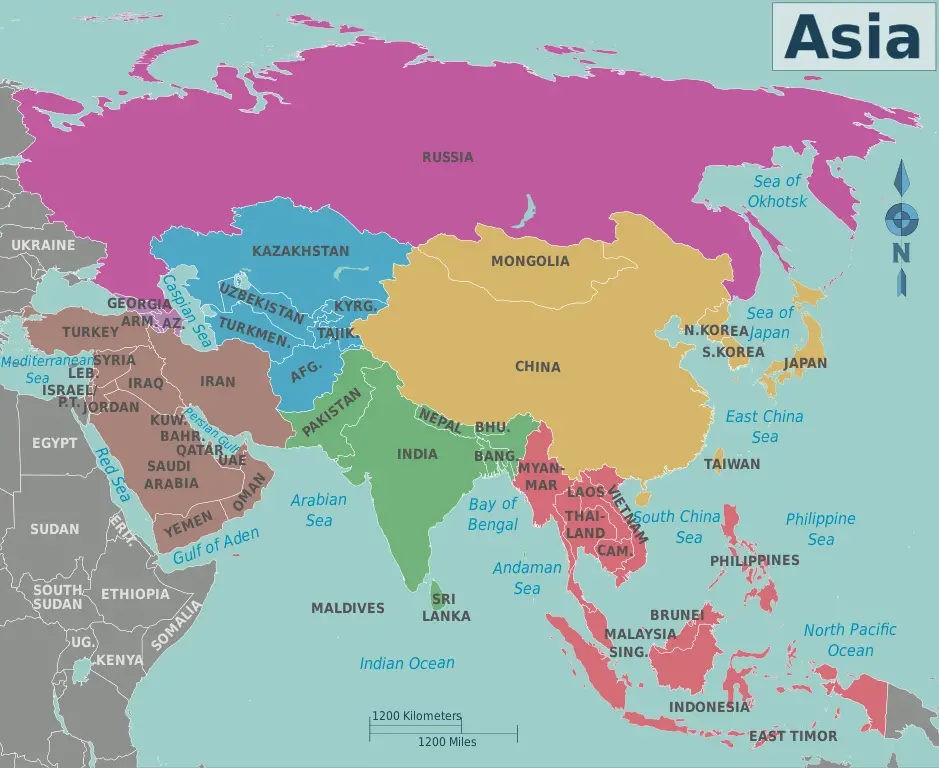
As the biggest continent on planet Earth, and harboring copious amounts of history that is rich in heritage and culture, the maps of Asia are complex and beautiful. You can find very intricate and detailed maps of countries such as India, China, Japan, Indonesia, Singapore, Thailand, and Korea. Maps of Asia also represent a lot of ongoing political issues. For instance, a map produced in India, Pakistan, and China will all show different borders for Kashmir, the center point of border disparity. Besides that, maps of Asia are very informative and cover many aspects of information.
European Countries
https://commons.wikimedia.org/wiki/File:Europe_countries_map_en_2.png
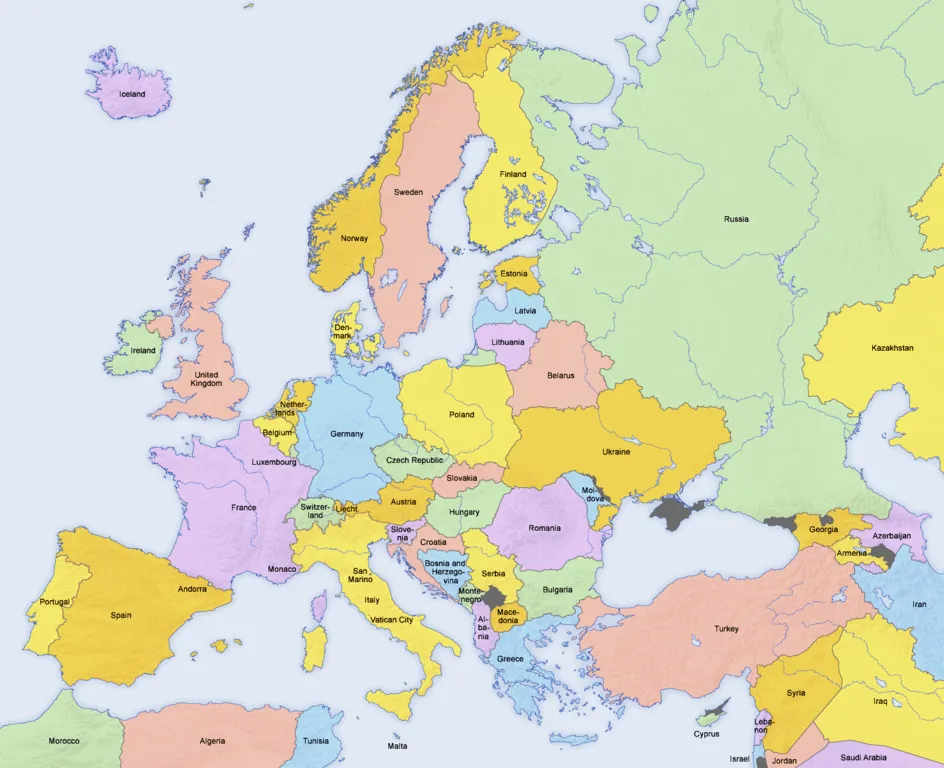
A map of Europe will have several small countries depicted on it, such as France, the UK, Germany, Italy, Spain, Norway, etc. Some maps of Europe will have Russia included in them, while others treat Russia as a separate region. Maps of Europe are largely used in the tourist industry since they give a detailed overview of the region to non-natives.
North America And South America

https://commons.wikimedia.org/wiki/File:%22Political_South_America%22_CIA_World_Factbook.svg
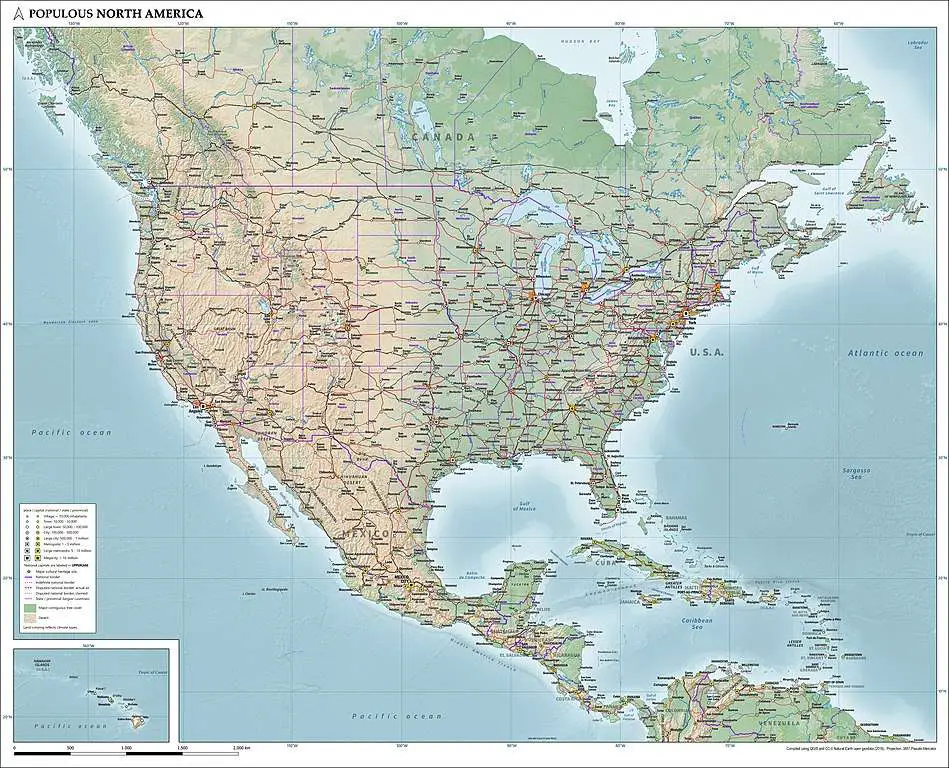
Maps of North and South America cover the countries in the two continents. Brazil, the United States, Canada, Argentina, and Mexico are some of the largest countries that can easily be identified on such a map.
Australia isn’t particularly specified in most of these maps and is covered largely in maps of the Southern Hemisphere or the pacific region. From topographic maps to geopolitical ones, most types of maps will cover this region in-depth.
Final Thoughts
Maps are a highly underrated source of information. You can find almost any sort of map detailing information visually about any topic of interest. With digital maps gaining popularity, access to informative maps has increased, and more advanced maps reflecting real-time data are being developed. Once you start using maps, you will quickly learn how to read and interpret them.


